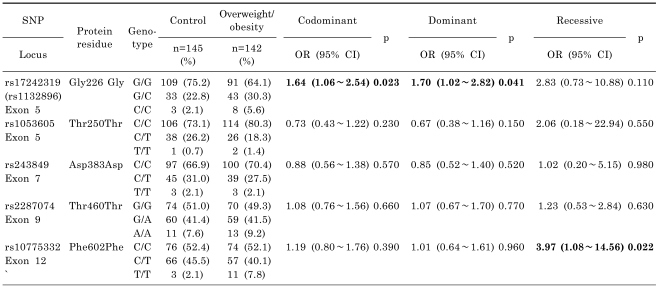
Table 1.
Logistic regression analysis and genotype frequency of matrix metallopeptidase 2 (MMP2) polymorphisms in control and overweight/obesity subjects
Genotype distributions are shown as number (%). Odds ratio (OR), 95% confidence interval (CI), and p values were from logistic regression analysis with codominant, dominant, and recessive models controlling age and gender as covariates. SNP, single nucleotide polymorphism.

