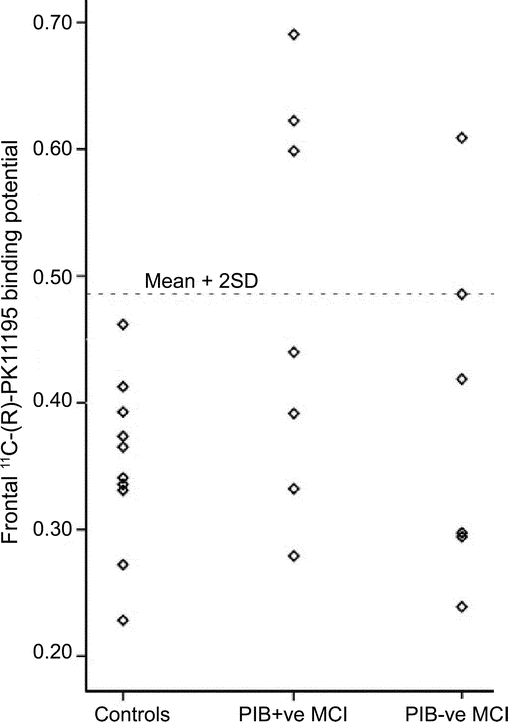
Figure 1 Scatterplot showing 11C-(R)-PK11195 binding potentials in frontal cortex of controls, and mild cognitive impairment (MCI) subgroups; PIB-positive (+ve) and PIB-negative (−ve) MCI
The dotted horizontal line shows controls' mean + 2 SD.

Figure 1 Scatterplot showing 11C-(R)-PK11195 binding potentials in frontal cortex of controls, and mild cognitive impairment (MCI) subgroups; PIB-positive (+ve) and PIB-negative (−ve) MCI
The dotted horizontal line shows controls' mean + 2 SD.