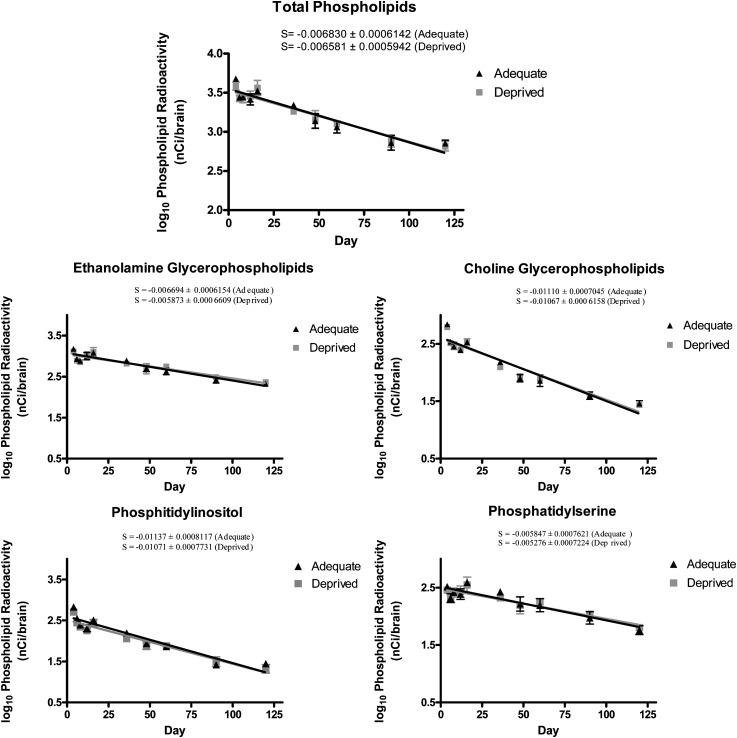
Fig. 1.
Linear regression slopes for (log10) phospholipid radioactivity (nCi/brain) over time (days). Adequate, n-3 PUFA adequate group; deprived, n-3 PUFA deprived group; day, time (days) following 15 weeks of feeding, after i.c.v. [3H] AA injection. Data are mean ± SE; n = 4 independent samples per group per time point (note differences in y axis scales.)

