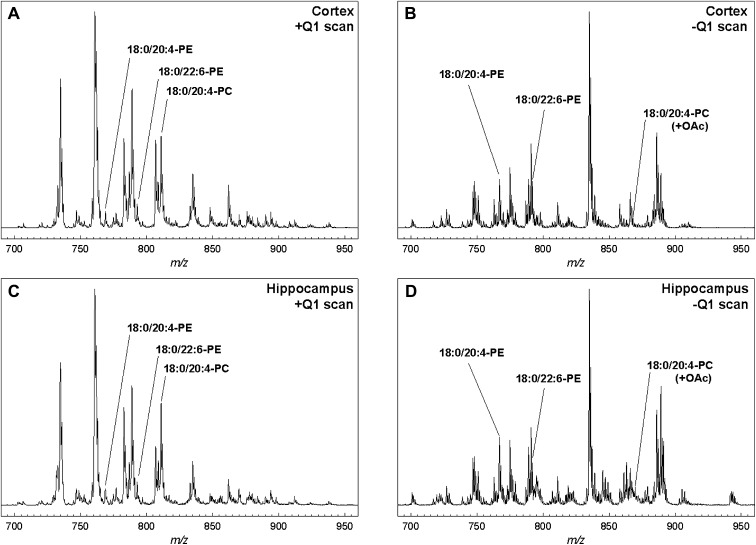
Fig. 1.
Simple mass spectra obtained by direct injection of mouse brain extracts. Panels A and B are from cerebral cortex while panels C and D are from hippocampus. A and C are positive mode scans, while B and D are negative mode scans. Peaks corresponding to 18:0/20:4-PE, 18:0/22:6-PE, and 18:0/20:4-PC are labeled to show that even the most abundant lipids containing AA and DHA are often minor features in spectra of this type (see Figs. 5 and 6).

