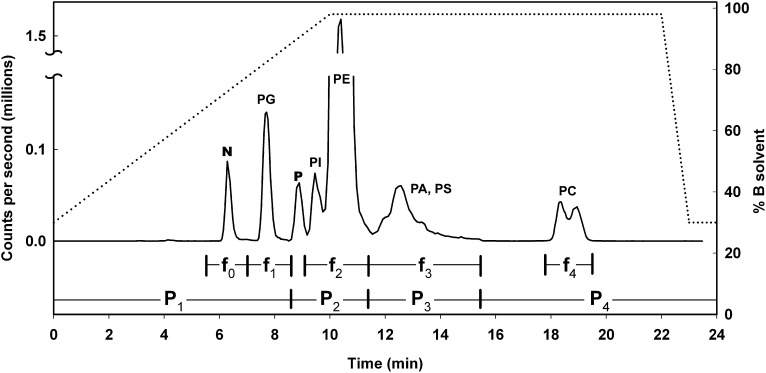
Fig. 2.
Total ion chromatogram obtained by injecting a 10-μl portion of a 350-μl brain extract onto the silica column, and the MRM method for AA-containing lipids (solid trace, left axis). The MRM method for DHA-containing lipids is similar, with only a 10-s leftward temporal displacement. The solvent gradient is also shown (dotted trace, right axis). The method was divided into four periods indicated by intervals P1 through P4. During P1 only PG transitions were monitored, and the peak is labeled ‘PG’. During P2, only PI and PE transitions were monitored and the peaks are labeled ‘PI’ and ‘PE’. During P3, only PA and PS transitions were monitored, and the broad overlapping peak is labeled ‘PA, PS’. During P4, only PC transitions were monitored and the split peak is labeled ‘PC’. The peak labeled ‘N’ includes neutral lipids such as triglycerides and cholesteryl esters. The peak labeled ‘P’ is an unidentified polymer. Intervals over which the five fractions collected for GC/MS analysis are indicated by f0 through f4.

