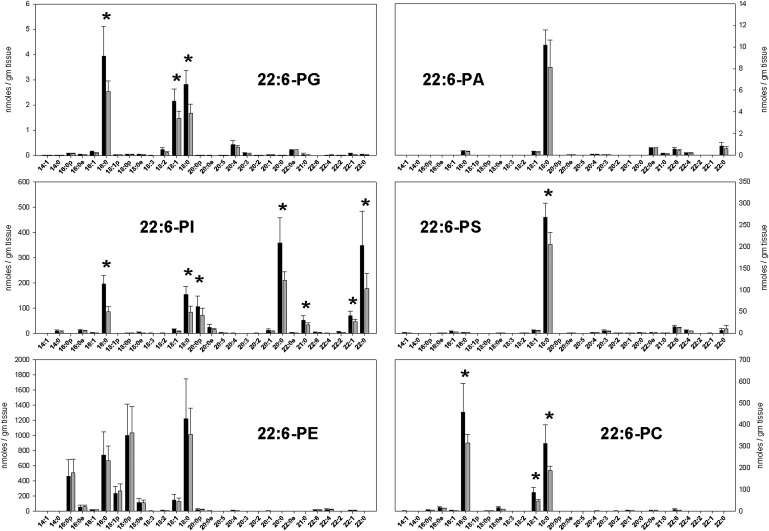
Fig. 6.
The concentrations of DHA-containing phospholipid species in cerebral cortex (black bars) and hippocampus (gray bars) in nmol/g tissue. Each result is the mean of six different brain extracts, and the error bars represent SD. An asterisk indicates results with statistically significant differences between brain regions. See text for information about the nature of quantitative uncertainty in these data.

