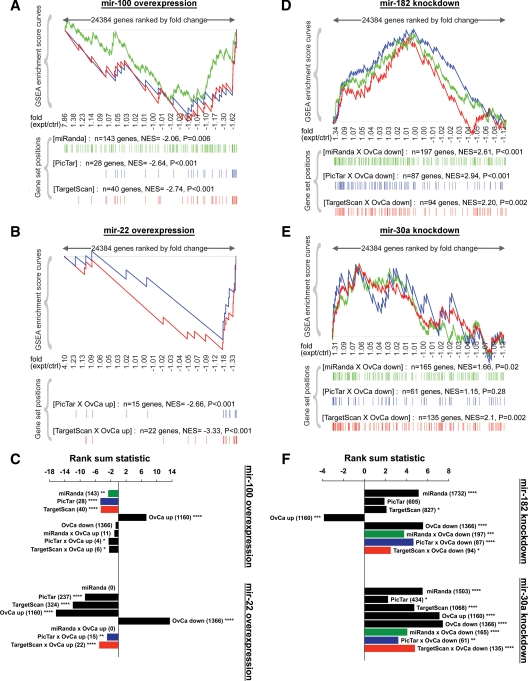
Figure 2.
Enrichment analysis of gene expression profiles after modulation of specific miRNAs in clear cell ovarian cancer cell lines. A, GSEA after mir-100 overexpression in OVSAYO cells. All genes on the microarray were ranked by fold change (overexpression/control), and the GSEA algorithm was used to identify significant patterns in gene sets of interest. For each gene set, vertical bars along the x-axis of the GSEA plot represent the positions of genes within the ranked list (i.e. their fold change). Negative GSEA enrichment score curve indicates antienrichment (down-regulation), and positive curve denotes enrichment (up-regulation). NES, Normalized enrichment score. Because there were very few genes overexpressed in clear cell ovarian cancer (OvCa up) that were also predicted targets of mir-100, we performed GSEA on all mir-100 target predictions by miRanda (green), PicTar (blue), or TargetScan (red), regardless of their expression pattern in ovarian cancer. B, GSEA after mir-22 overexpression in ES-2 cells to examine OvCa up genes that were also predicted mir-22 targets by PicTar or TargetScan. There were no mir-22 targets predicted by miRanda (September 2008 release, MIMAT0000077). C, Spearman's rank sum analysis after overexpression of mir-100 (top) or mir-22 (bottom). For each miRNA, the gene sets of interest included all predicted targets by miRanda, PicTar, or TargetScan; all genes overexpressed (OvCa up) or underexpressed (OvCa down) in clear cell ovarian cancer; and OvCa up genes that were also predicted miRNA targets by miRanda, PicTar, or TargetScan. Numbers of genes in each set are indicated in parentheses. Negative rank sum statistic indicates antienrichment (down-regulation), and positive statistic denotes enrichment (up-regulation). Colors correspond to the sets analyzed by GSEA in panels A and B. D, GSEA after knockdown of mir-182 in ES-2 cells to examine OvCa down genes that were also predicted mir-182 targets. E, GSEA after knockdown of mir-30a in OVSAYO cells. F, Spearman's rank sum analysis after knockdown of mir-182 (top) or mir-30a (bottom). Gene sets of interest were similar to panel C but instead included OvCa down genes that were also predicted miRNA targets. Colors correspond to the sets analyzed by GSEA in panels E and F. Two-sided significance levels: *, P < 0.05; **, P < 0.01; ***, P < 0.001; ****, P < 0.0001. ctrl, Control; expt, experimental.

