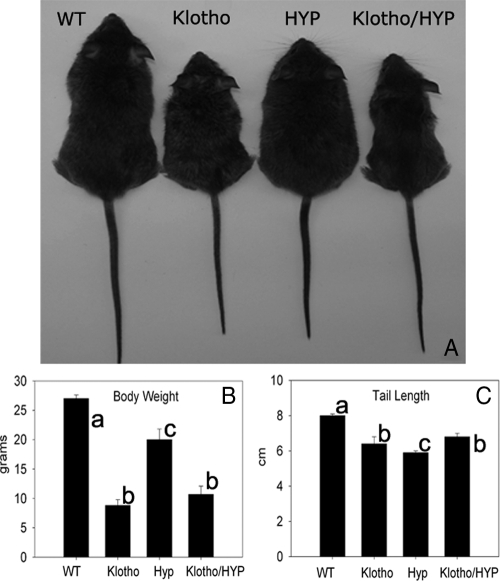
Figure 1.
A, Six-week-old WT, Klotho, HYP, and Klotho/HYP mice; B and C, bar graphs indicate average body weight (B) and tail length (C) for the four genotypes. n = 6 for all groups. Differing lowercase letters indicate statistically significant differences (P < 0.05) between the groups. Bars with the same letters are not significantly different. Precise statistical significance values are identified in the accompanying text.

