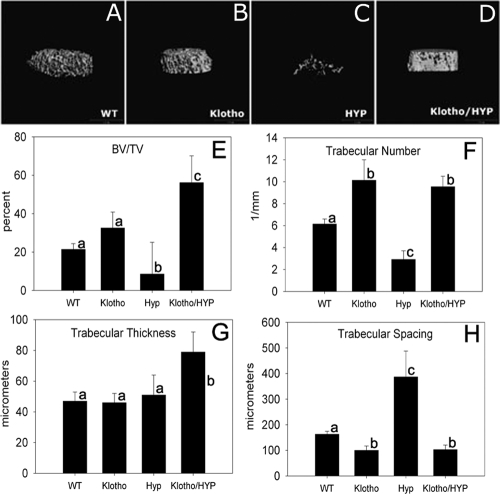
Figure 3.
A–D, Representative μCT generated images of trabecular bone from femur distal metaphyses of WT (A), Klotho (B), HYP (C) and Klotho/HYP (D) mice; E–H, bar graphs show the derived values from μCT analysis for bone volume/total volume (E), trabecular number (F), trabecular thickness (G), and trabecular spacing (H). n = 6 for all groups. Differing lowercase letters indicate statistically significant differences (P < 0.05) between the groups. Bars with the same letters are not significantly different.

