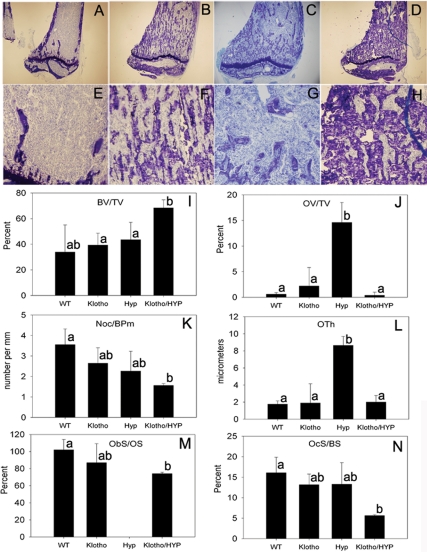
Figure 5.
Histomorphometric analysis. A–H, Undecalcified tibial sections stained with toluidine blue; A–D, ×4 magnification of WT, Klotho, HYP, and Klotho/HYP; E–H, ×10 magnifications of WT, Klotho, HYP, and Klotho/HYP bone. I–N, Bar graphs showing the total bone volume (BV/TV; I), osteoid volume/bone volume (OV/TV; J), number of osteoclasts/bone perimeter (Noc/BPm; K), osteoid thickness (OTh; L), osteoblast surface/osteoid surface (ObS/OS; M), and osteoclast surface/bone surface (OcS/BS; N) determined by histomorphometric analysis of sections from three to four tibias from each group. Differing lowercase letters indicate statistically significant differences (P < 0.05) between the groups. Bars with the same letters are not significantly different.

