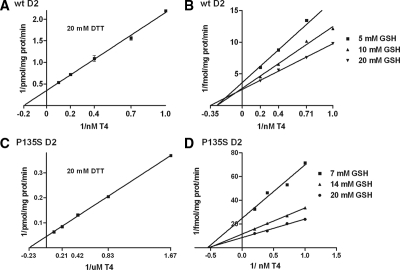
Figure 2.
Lineweaver-Burk plots comparing wt D2 and D2 P135S kinetics with respect to T4 using DTT or GSH as cofactor. A, Double-reciprocal plot of wt D2 activity using DTT 20 mm as cofactor and varying T4 concentrations. B, Double-reciprocal plot of wt D2 activity using GSH concentrations of 5, 10, and 20 mm. C, Double-reciprocal plots of P135S D2 activity with 20 mm and varying T4 concentrations. D, Double-reciprocal plots of T4 deiodination by P135S D2 at GSH concentrations of 7, 14, and 20 mm.

