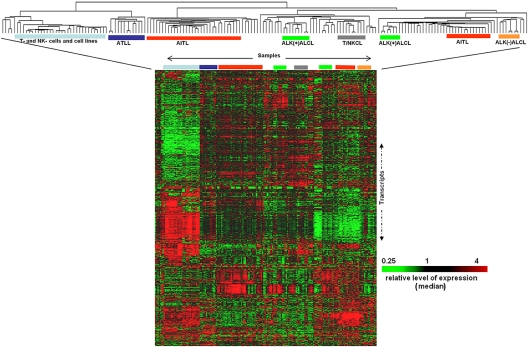
Figure 1.
Normal T and NK cells, cell lines, and PTCL cases classified by unsupervised hierarchical clustering: Major entities of PTCL form tight clusters with cases of PTCL-NOS and other rare entities interspersed. Each column represents a case and each row the expression level of a gene. Gene expression level is depicted according to the color scale shown.

