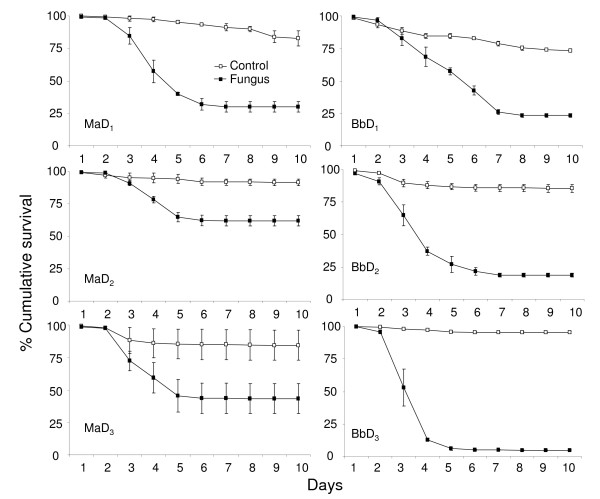
Figure 6.
Survival curves of An. gambiae at different densities. Percentage cumulative survival curves of An. gambiae larvae, exposed to 10 mg of M. anisopliae (Ma) and B. bassiana (Bb) spores, at different densities (D1, 0.5 larvae/cm2; D2, 0.3 larvae/cm2; D3, 0.1 larvae/cm2). The survival curves include the larvae that survived due to pupation.

