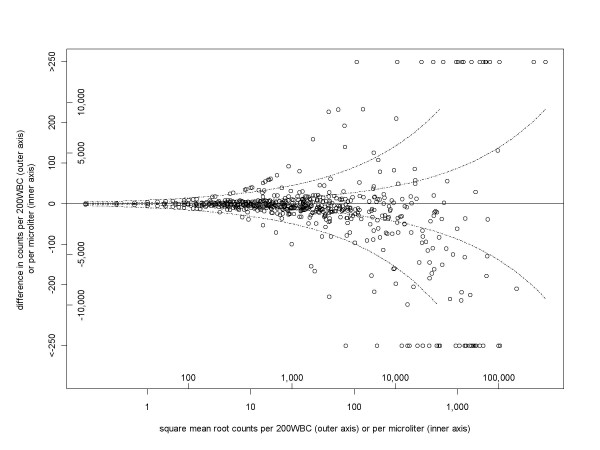
Figure 2.
Variation between readers increasing with parasite density: cross-section study[29]. The vertical axis is the between-reader difference in terms of numbers actually counted (outer vertical axis) or in density per microliter (assuming 8,000 white blood cells per microliter, inner vertical axis). This is a back-transformation of Figure 1c, except that pairs with a zero reading are included, giving 1,564 pairs. The 95% range of difference in square roots is -4.9 to +4.5. These values are shown in the outer pair of curved dashed lines, corresponding to horizontal lines in Figure 1c. The inner pair of dashed lines is the lower limit on this 95% range, derived from the Poisson distribution (-1.39 to +1.39). As done for Figure 1c, differences of more than 250 are shown together at the limits of the vertical axis.

