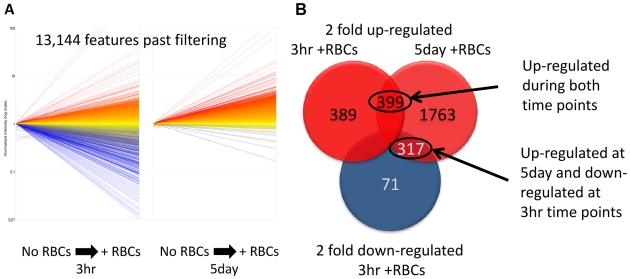
Figure 3. Number of genes differentially expressed in 3 h and 5 day cultured S. mansoni schistosomula in the presence of erythrocytes.
(A) Scatter plot of the overall change in expression of 3 h and 5 day old schistosomula, cultured in the presence of erythrocytes and normalised to parasites cultured without erythrocytes. Relative up-regulation is shown in red, and relative down-regulation in blue. No differential gene expression is presented in yellow (B) Number of genes either up- or down-regulated >2-fold in 3 h or 5 day schistosomula cultured in the presence of erythrocytes relative to parasites cultured without erythrocytes; numbers in the overlapping region of the Venn diagram indicate genes that were differentially expressed in more than one group. Relative up-regulation is shown in red, and relative down-regulation in blue. Number of up-regulated genes in both time points (3 h and 5 day) and number of genes up-regulated at 5 day but down-regulated at 3 h time points are circled and annotated.

