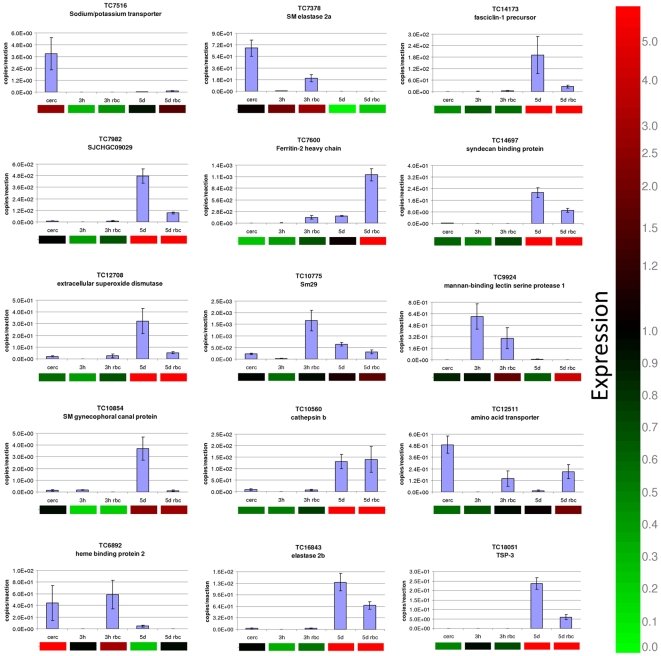
Figure 5. Validation of a subset of differentially expressed genes in 3 h and 5 day schistosomula of S. mansoni cultured in the presence or absence of erythrocytes.
Quantitative real time PCR data, expressed as copy number per reaction, are presented as bar graphs, while the corresponding microarray data are shown below the graphs as heat maps. Microarray gene expression is indicated by up-regulation (red), down-regulation (green) or unchanged (black). The microarray data were not normalised to any sample.

