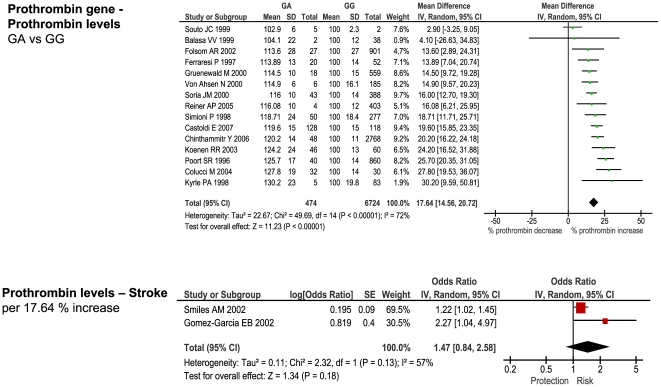
Figure 13. Forest plots showing quantitative relationship between genetic polymorphisms and associated biochemical variables for: Prothrombin G20210A and prothrombin levels.
Additional forest plots are shown in Figures 10, and 13– 15 that relate set changes in biochemical variables (determined from the first set of meta-analyses within each figure) with risk of stroke. For MTHFR and ACE this relationship is determined from a single study each.

