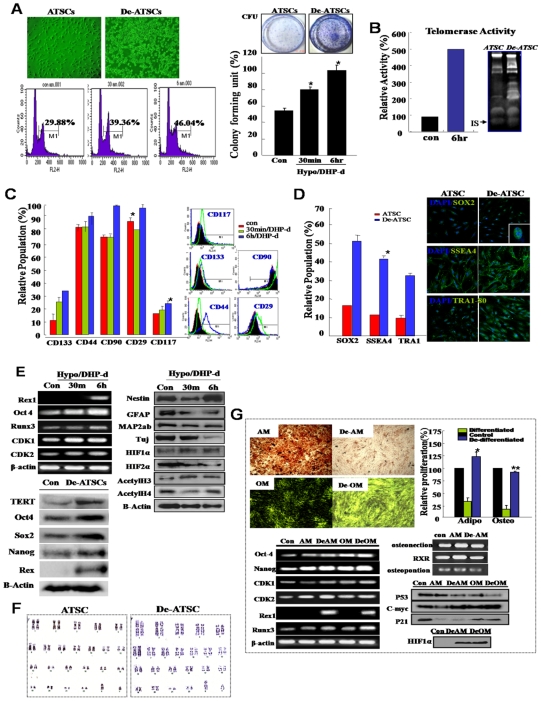
Figure 1. Combinational hypoxia/DHP-d induced various de-differentiation behaviors in hATSC cells.
(A) The proliferation activity of cultured hypoxia/DHP-d-induced ATSC. Flow cytometric analysis and measuring colony forming units (CFU). For flow cytometric analysis, cells were cultured in 100-mm dishes at densities that ensured exponential growth at the time of harvesting. Harvesting and processing protocols were used to detect DNA via flow cytometry with propidium iodide. The percentages of cells in the G0/G1, S, and G2/M phases of the cell cycle were determined using a DNA histogram fitting program. Clonogenic cell growth experiments were conducted for the detection of colony forming units (CFU). (B) Telomerase assay of de-ATSC compared to control ATSC. Telomerase activity was assessed using a modified TRAP assay using synthetic oligonucleotide, telomerase-specific primer. (C) The expression of surface epitopes changed in de-ATSC. For phenotypic characterization by flow cytometry, de-differentiated ATSC and cultured ATSC adherent cells were incubated with antibodies. The labeled cells were analyzed with a FACScan argon laser cytometer. (D) Analysis of stem cells phenotypic change in cultured de-ATSCs through TRA 1-80, SSEA4, and Sox2 expression analysis. (E) Determination of differential expression of stemness, neural markers, and cell proliferation-associated genes by real time RT-PCR and Western blotting. (F) Detection and confirmation of the chromosomal normality of cultured de-ATSC via karyotyping analysis. (G) De-differentiation of terminal differentiated ATSC-derived bone and evaluation of fat and their pluripotencies through differentiated fat and bone staining and related gene expression analysis. Datas presented are presented as mean ±SD; n>3. * p % 0.05 and ** p % 0.01, Student's t test.

