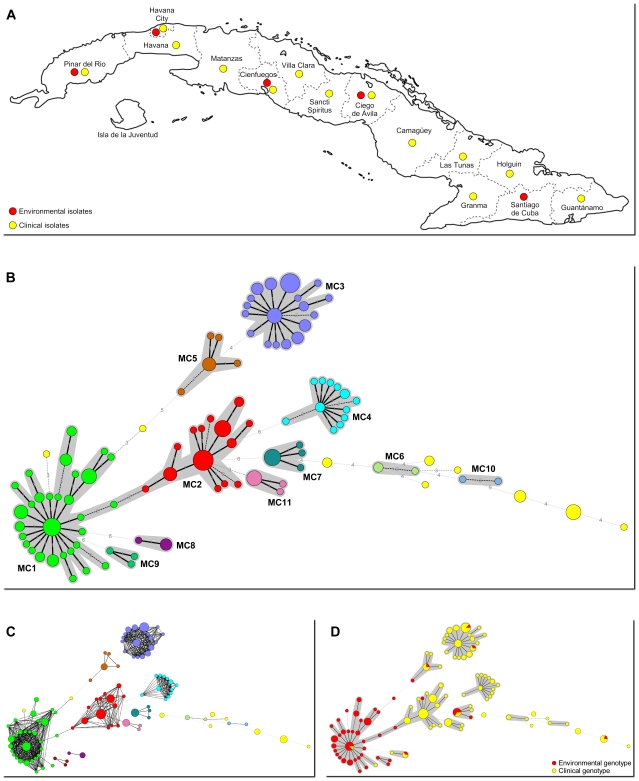
Figure 1. Origin of samples and relationships between genotypes.
A: Map of Cuba. Colored dots indicate provinces from which clinical and/or environmental samples were available. B: Minimum spanning tree (MST) based on a multistate categorical analysis representing the genotypes of 190 C. neoformans var. grubii isolates from Cuba. Each circle represents a unique genotype. The size of the circle corresponds to the number of isolates with that genotype. Genotypes are linked to their closest relative. Numbers and connecting lines correspond to the number of different markers between genotypes. Genotypes with identical colors and connected by a shaded background are part of a microsatellite complex (MC). In yellow are unique genotypes that are not part of a MC. C: Same as B, but now showing cross-links between all genotypes that differ in no more than 2 markers. D: Same MST as in B, but now showing genotypes obtained from clinical and environmental samples.

