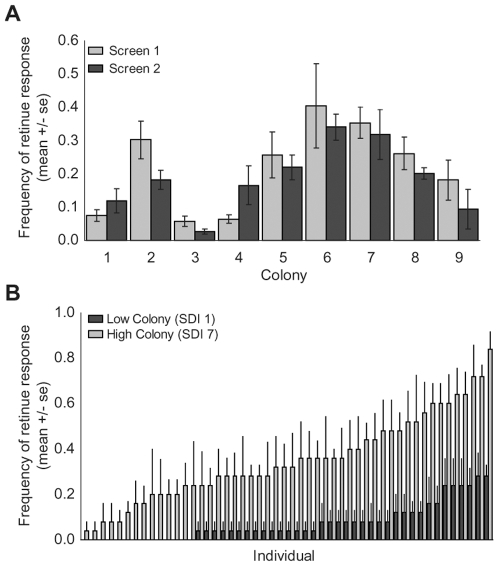
Figure 1. Retinue response varies among colonies and among individuals within a colony.
A. 9 SDI colonies were screened for retinue response. There were strong differences among colonies in mean retinue response frequency (p<0.0001). There was a significant effect of day on colony response (p = 0.003), but no significant effect of the time of the screen (p = 0.09), cage (p = 0.14), or any significant colony by day (p = 0.10) or colony by screen (p = 0.42) interaction. B. Based on the results of the previous screens, two A.m. carnica colonies were selected for the subsequent molecular and physiological analyses. The previous retinue bioassay was modified to measure individual variation in response to QMP. There were significant individual differences in retinue response frequency among individuals in both colonies (p<0.001).

