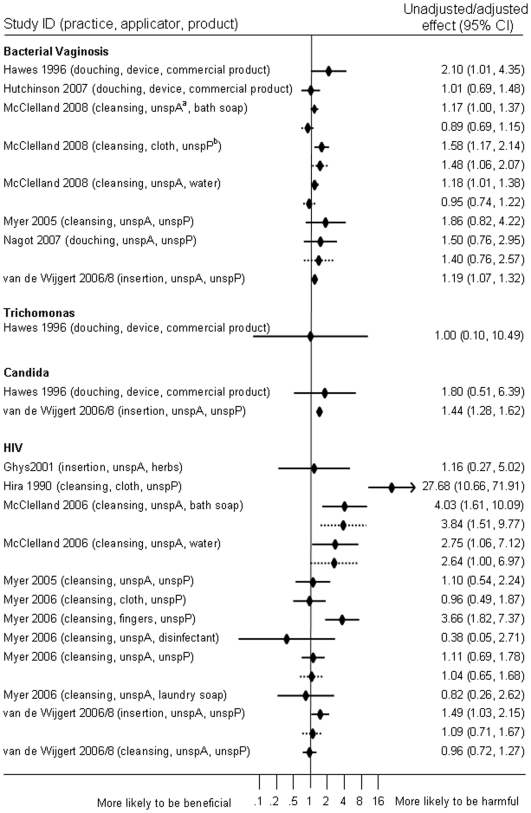
Figure 3. Forest plot of all reported and quantified associations between intravaginal practices and any infection.
Forest plot showing unadjusted and/or adjusted effect estimates reported in included studies, according to the infection studied as the outcome. Individual studies can be included more than once if multiple outcomes are reported. If both unadjusted and adjusted effects were reported for the same combination of practice, product and applicator, these are presented with the unadjusted effect estimate above the adjusted effect estimate. No pooled estimates are shown in this plot. Minor differences between effect estimates in the table and those in published papers are possible.

