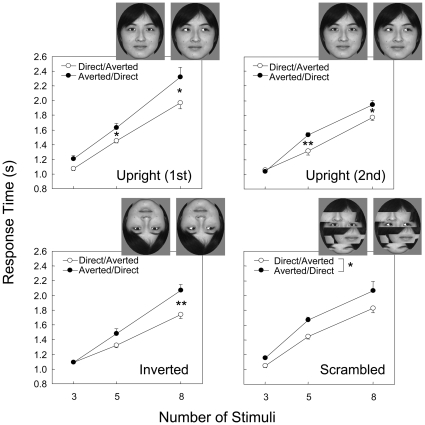
Figure 2. Mean response times in correct trials for each condition as a function of the number of stimulus items in the visual-search testing in Experiment 1.
Error bars indicate standard errors of means across sessions. *p<0.05; **p<0.01. Chloe showed faster response times when the direct-gaze face than when the averted-gaze face was the target irrespective of the facial configurations.

