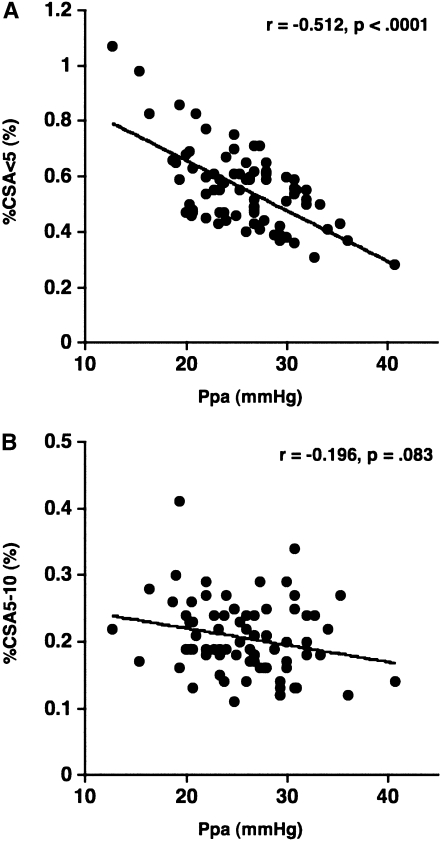
Figure 2.
The relationship between the pulmonary arterial mean pressure ( ) and (A) the percentage of the area taken up by the cross-sectional area (CSA) of pulmonary vessels smaller than 5 mm2 (%CSA<5), and (B) the percentage of the area taken up by the CSA of pulmonary vessels between 5 mm2 and 10 mm2 (%CSA5–10).
  has a significant negative correlation with %CSA<5 (r = −0.512, P < 0.0001), whereas there is no significant correlation between
  and %CSA5–10 (r = −0.196, P = 0.083).

