Figure 1.

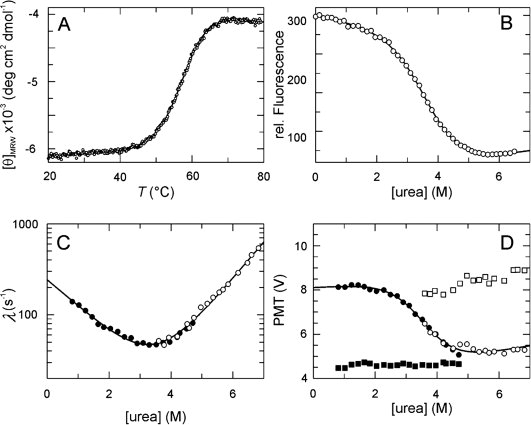
Stability and folding kinetics of PpiD*. (A) Thermal transition of 4 μM PpiD* measured by CD at 222 nm. The two-state analysis (continuous line) results in TM = 57.1 ± 0.1°C and ΔHD = 253 ± 10 kJ mol−1. (B) Urea-induced unfolding transition of 1 μM protein at 25°C measured by protein fluorescence at 340 nm after excitation at 280 nm in 100 mM K phosphate (pH 7.0). The two-state analysis (continuous line) gives values of ΔGD25°C = 15.3 ± 0.6 kJ mol−1, m = 4.2 ± 0.3 kJ mol−1 M−1 and [urea]M = 3.6M. (C) Refolding kinetics (filled symbols) and unfolding kinetics (open symbols). The apparent rate constants λ are shown as a function of the urea concentration. A chevron fitted to the experimental data based on a linear two-state model is shown by the continuous line. The results of the analysis are: knu = 0.99 ± 0.09 s−1, kun = 241 ± 14 s−1, mnu = 0.92 ± 0.02 M−1, mun = − 0.67 ± 0.04 M−1, ΔGD25°C = 14.0 ± 0.4 kJ mol−1, m = 4.0 ± 0.1 kJ mol−1 M−1, [urea]M = 3.5M. (D) Initial (▪,□) and final (•,○) values of the unfolding (open symbols) and refolding (closed symbols) kinetics as a function of the urea concentration. The continuous line indicates the fit of a transition curve to the final values, giving the following parameters: ΔGD25°C = 16.3 ± 2.8 kJ mol−1, m = 4.5 ± 0.7 kJ mol−1 M−1, [urea]M = 3.6M. The folding kinetics were measured after stopped-flow mixing by the change in fluorescence above 320 nm (excitation at 280 nm) in 100 mM K phosphate, pH 7.0 at 25°C.
