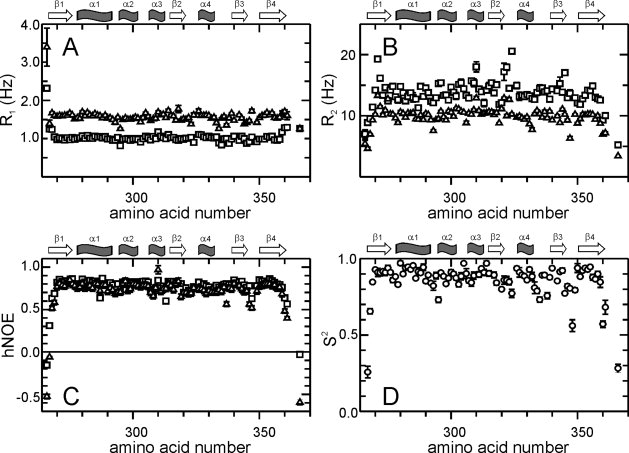
Figure 3.

Picoseconds to nanoseconds dynamics of PpiD*. (A) R1 rates, (B) R2 rates, (C) 15N hetero nuclear NOEs and order parameter S2 are plotted as a function of the amino acid sequence. Parameters shown as squares in (A–C) were derived at 800 MHz, those shown as triangles at 600 MHz proton resonance frequency. (D) Order parameters S2 calculated using both datasets in MODELFREE.38 The secondary structure elements are indicated at the top of each panel.
