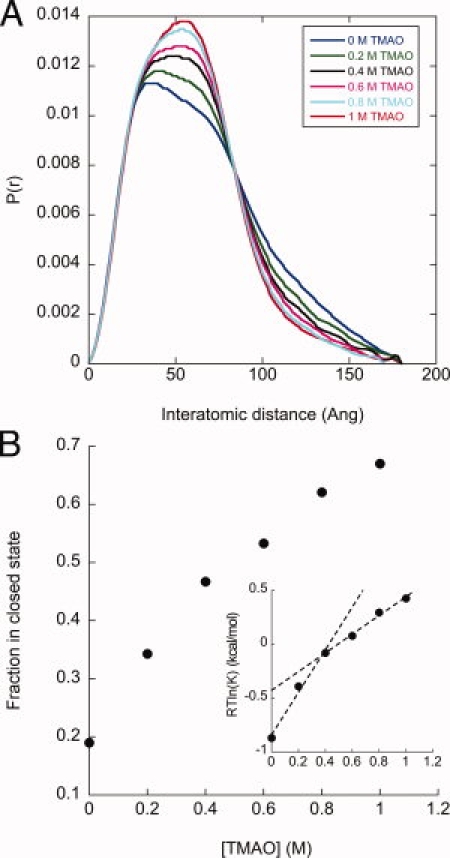
Figure 4.

Determining m-values for the open/closed transition. (A) A titration of TMAO concentrations indicates a smooth shift in the P(r) distributions, reflecting a shift in the open/closed equilibrium. (B) The two-state fitting method was used to determine the population of the open and closed states, and define the equilibrium constant (K = [open]/[closed]). The inset plots the free energy of the open/closed equilibrium and is fit with two linear arms above and below 0.4M TMAO (dashed lines).
