
Figure 3.
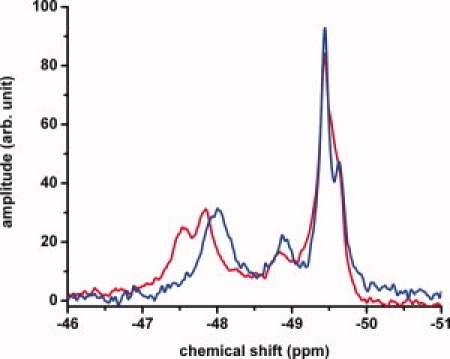
19F NMR spectrum of apoE4-C-terminal mutant (blue) and apoE3-C-terminal mutant (red). Experiments performed using 60 μM apoE mutants in 20 mM HEPES, 80 mM NaCl, 0.1% βME and pH 7.4. For comparison, the spectra were normalized to the same total intensity under the peaks.