
Figure 3.
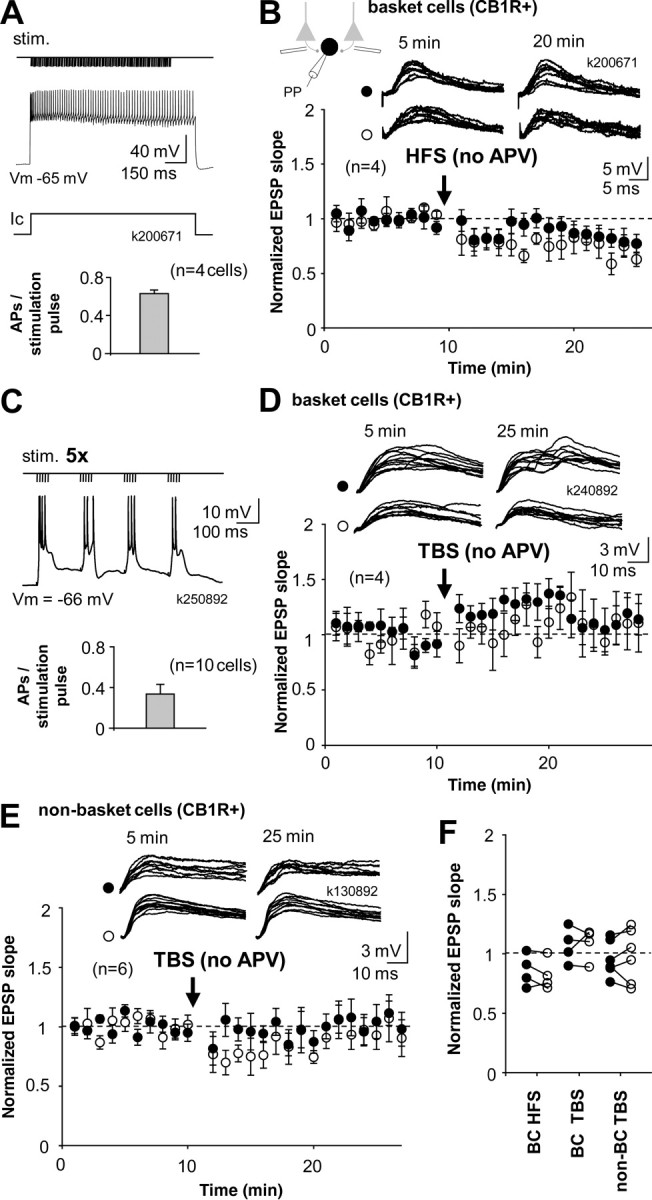
CB1R+ basket cells and non-basket cells with intact NMDAR-mediated transmission fail to show long-term plasticity. A, Schematic shows HFS protocol; tetanic stimulation (stim.) to one pathway is paired with depolarization of postsynaptic cell to 0 mV in current clamp (Ic). NMDARs are not blocked. Histogram shows that intense firing of postsynaptic action potentials (APs) was associated with presynaptic stimuli. B, Mean ± SE of EPSP slope from four cells recorded in perforated patch and identified post hoc as CB1R+ basket cells. None of the cells showed significant lasting plasticity in the EPSP. Top, EPSPs in the two pathways during baseline and 10 min after HFS. C, Schematic shows TBS stimulation protocol; trains of stimuli (100 Hz, five pulses) are delivered to one pathway at 5 Hz, while postsynaptic cell is at resting membrane potential (action potentials truncated). Histogram shows number of postsynaptic action potentials elicited by presynaptic stimuli. D, Perforated patch recording from four CB1R+ basket cells showed EPSPs without lasting plasticity. EPSP slope in theta-bursted pathway was not different from baseline or from control pathway 15 min after the TBS. Top, Consecutive EPSP traces from one experiment. E, Similar recordings show lack of long-term plasticity of EPSPs in CB1R+ non-basket cells (n = 6). Cells were repatched and identified as above. Top, EPSPs from an individual experiment. F, Baseline-normalized average EPSPs in the three types of experiments shown above. Filled symbols indicate HFS- or TBS-treated pathway, and open symbols show the control pathway. Data are taken 10–15 min after the HFS or TBS.