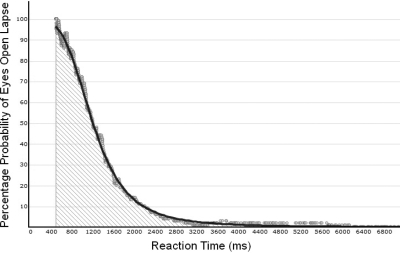
Figure 3.
Example of relationship between mean RT and likelihood of the eyes being open. All lapses were ranked in duration, with each then expressed as percentage of the preceding 100 for EO, creating a 100-point moving average. Using a least squares function fit, the percent of lapses with eyes open (y) for any given lapse duration (x) is shown. A power law function curve was the best fit for the data (r2=0.99) and the resultant formula gives the percentage probability of the eyes being open (y) for any given lapse duration (x). After 7000 ms, the % probability tails off as all lapses had a < 1% chance of occurring with the eyes open.

