
Figure 4.
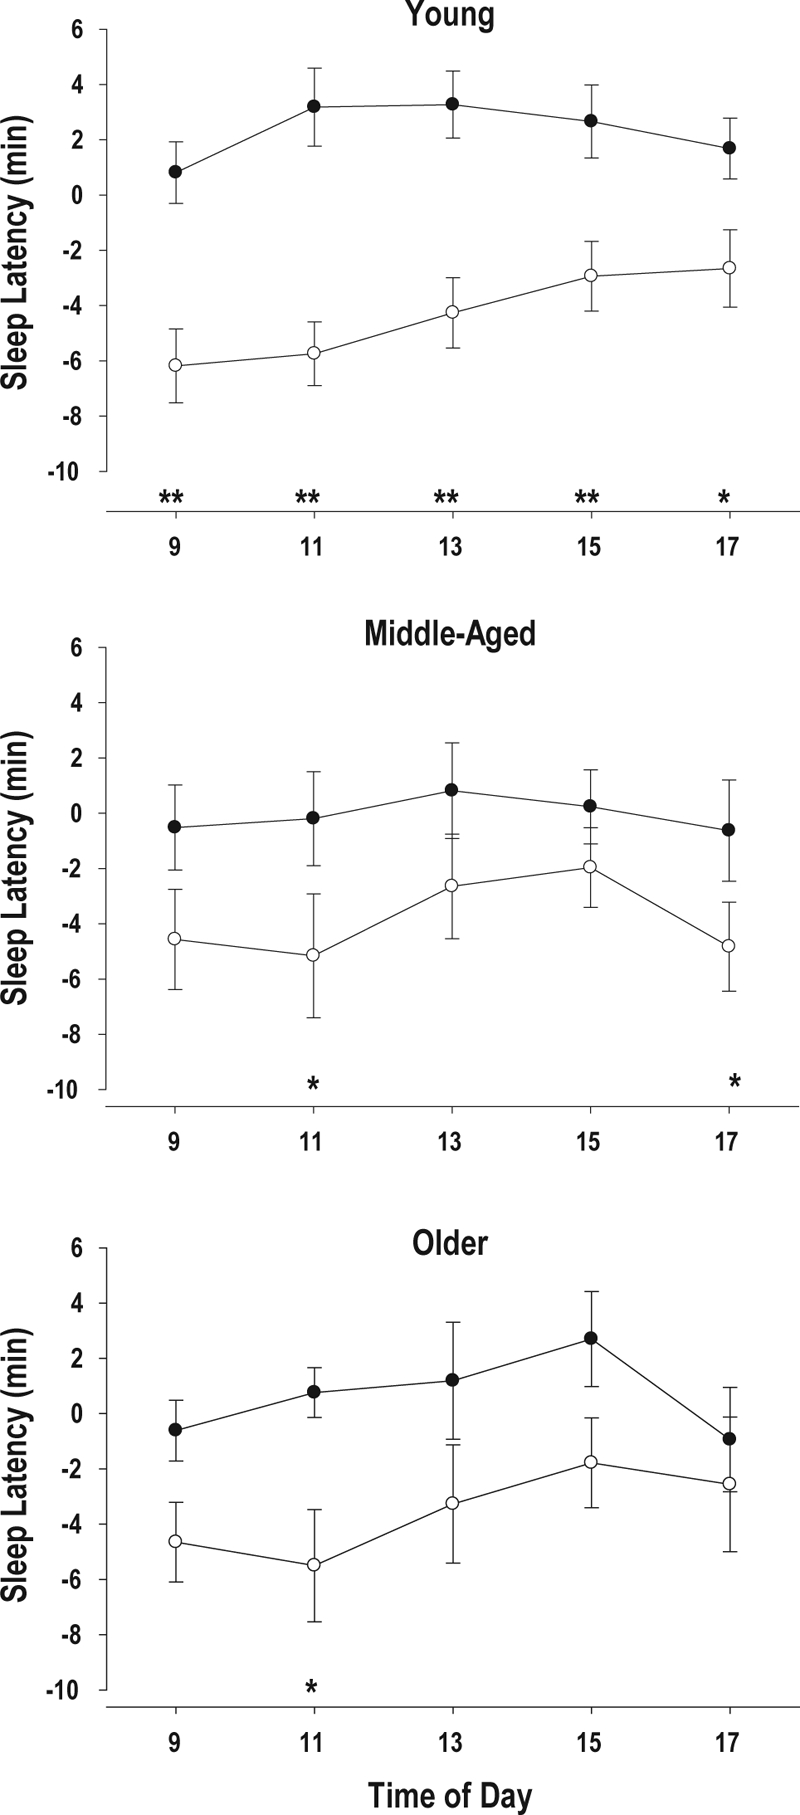
Change from Baseline for MSLT (Mean ± SE) at 5 time points during D2 in the Control (•) and SWS disruption (○) group in the young, middle-aged and older subjects. D2 is the days after two nights of SWS disruption/Control
*P < 0.05; **P < 0.01; Control vs. SWS Disruption.