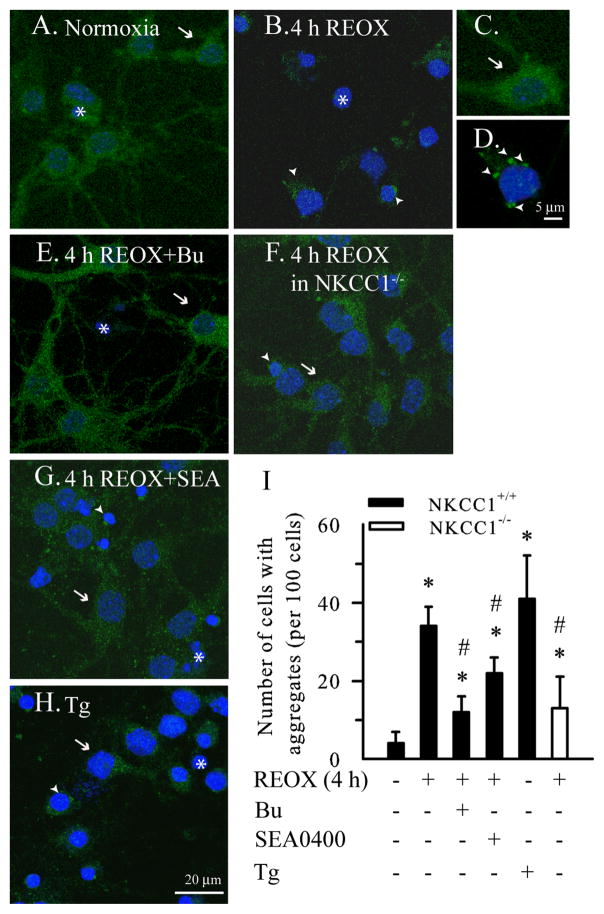
Figure 2. Detection of ubiquitin-conjugated proteins with immunostaining.
Ubiquitin distribution was analyzed with the anti-ubiquitin monoclonal antibody using confocal microscopy. Drug treatments were identical to Figure 1. A. Normoxic control. B. 2 h OGD/4 h REOX. C, D. Magnified images of neurons in A and B. E. 2 h OGD/4 h REOX plus Bu. F. NKCC1−/− neurons following 2 h OGD/4 h REOX. G. 2 h OGD/4 h REOX plus SEA0400. H. Tg for 24 h. I. Summary data. Data are mean ± SD. n = 3–5. * p < 0.05 vs. normoxic control; # p < 0.05 vs. 4 h REOX. Green: ubiquitin immunosignals. Blue: nucleus staining with To-pro-3 iodide. Arrow: cell with normal ubiquitin distribution. Arrowhead: cell with ubi-proteins. Asterisk: nuclei.

