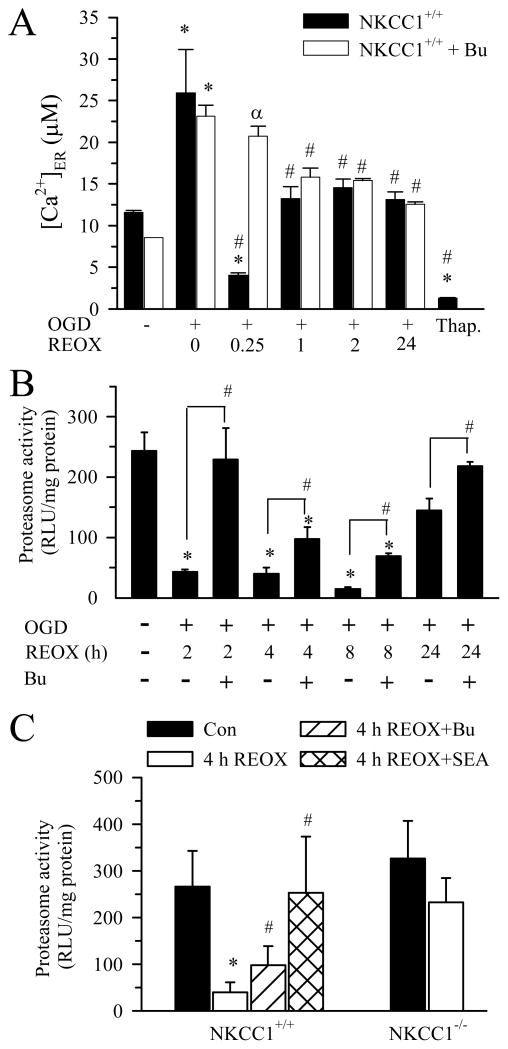
Figure 3. Changes of ER Ca2+ and proteasomal activity following OGD/REOX.
A. ER Ca2+ was determined in neurons subjected to 2 h OGD and 0–24 h REOX. In the bumetanide studies, neurons were pretreated with 10μM bumetanide that was then present throughout the experiment. In some experiments, neurons were subjected to 0.1 μM Tg for 24 h. Data are mean ± SEM. n = 3–9. * p < 0.05 vs. normoxic control; # p < 0.05 vs. corresponding 0 REOX; α p < 0.05 vs corresponding non-treated. B. Proteasomal activity in neurons under different conditions. NKCC1+/+ neurons were subjected to 2 h OGD and 2, 4, 8, 24 h REOX. In the case of Bu treatment, 10 μM Bu was added 30 min prior to OGD and present in all subsequent incubations. Data are means ± SEM. n = 3–4. * p < 0.05 vs. normoxic control; # p < 0.05 vs. corresponding non-treated. C. Effects of inhibition of NCXrev and NKCC1 activity on proteasomal activity. NKCC1−/− and NKCC1+/+ littermate cultures were subjected to 2 h OGD and 4 h REOX. In SEA0400 treatment, 1 μM SEA0400 was present at 0–4 h REOX. In the case of Bu treatment, 10 μM Bu was added 30 min prior to OGD and present in all subsequent incubations. Data are mean ± SEM. n = 4. * p < 0.05 vs. NKCC1+/+ normoxic control; # p < 0.05 vs. NKCC1+/+ 4 h REOX.

