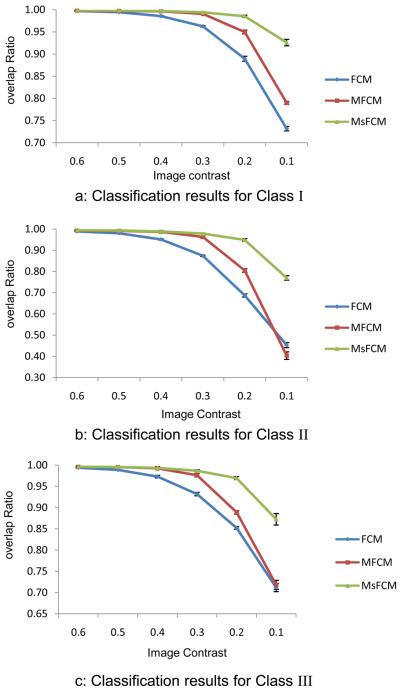
Fig.6.
Quantitative evaluation of the classification results for synthesized images with three classes I, II, and III. The Y axis is the overlap ratio between the ground truth and the classification results. The X-axis represents the contrast levels. Each data point represents 5 classification results from 5 images. Mean and standard deviation are plotted for each method. The MsFCM consistently works better than the other two methods for all of the three classes and contrast levels.

