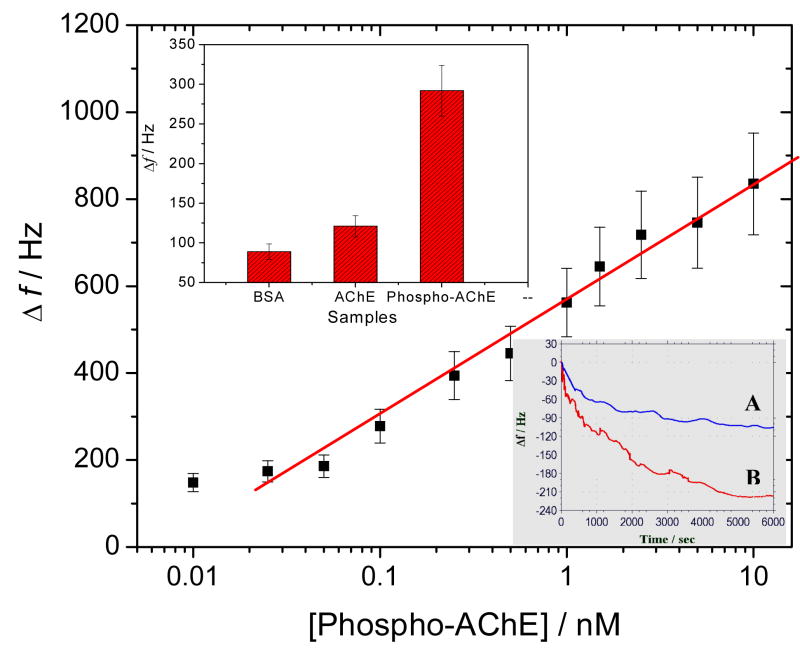
Fig. 6.
Calibration curve plotted on a semi-log scale for detecting Phospho-AChE in plasma samples, with a detection limit of 0.020 nM. The top insert shows the comparison of final Δf responses of immunoassays for BSA (10 mg ml−1), AChE (0.1 nM) and Phospho-AChE (0.1 nM), and the bottom insert manifests the real-time EQCM monitoring for the direct adsorptions of 0.5 nM (A) AChE and (B) Phospho-AChE onto the ZrO2-coated crystals.

