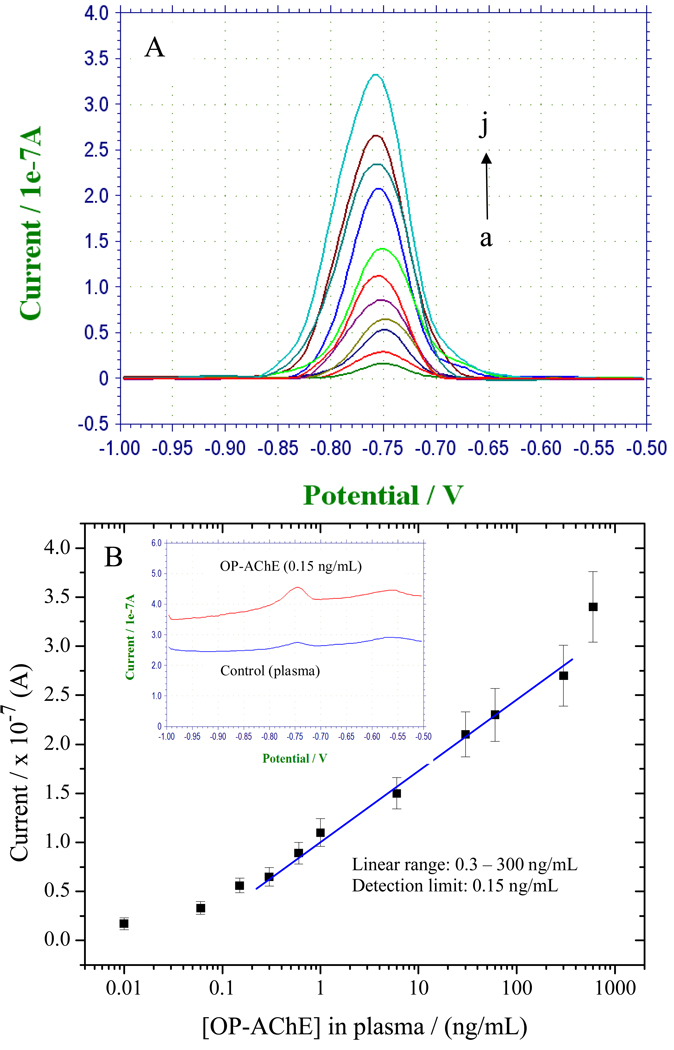
Figure 8.
(A) Typical electrochemical SWV responses of the immunoassays for OP-AChE with increasing plasma concentrations under the optimized conditions, where curve a–j correspond to 0.01, 0.06, 0.15, 0.3, 0.6, 1.0, 6, 30, 60, 300 and 600 ng/mL of OP-AChE in plasma, respectively; (B) The resulting calibration curve plotted on a semi-log scale, where the inset shows comparably the SWV responses to the detection limit of 0.15 ng/mL and 0 ng/mL(control plasma) of OP-AChE

