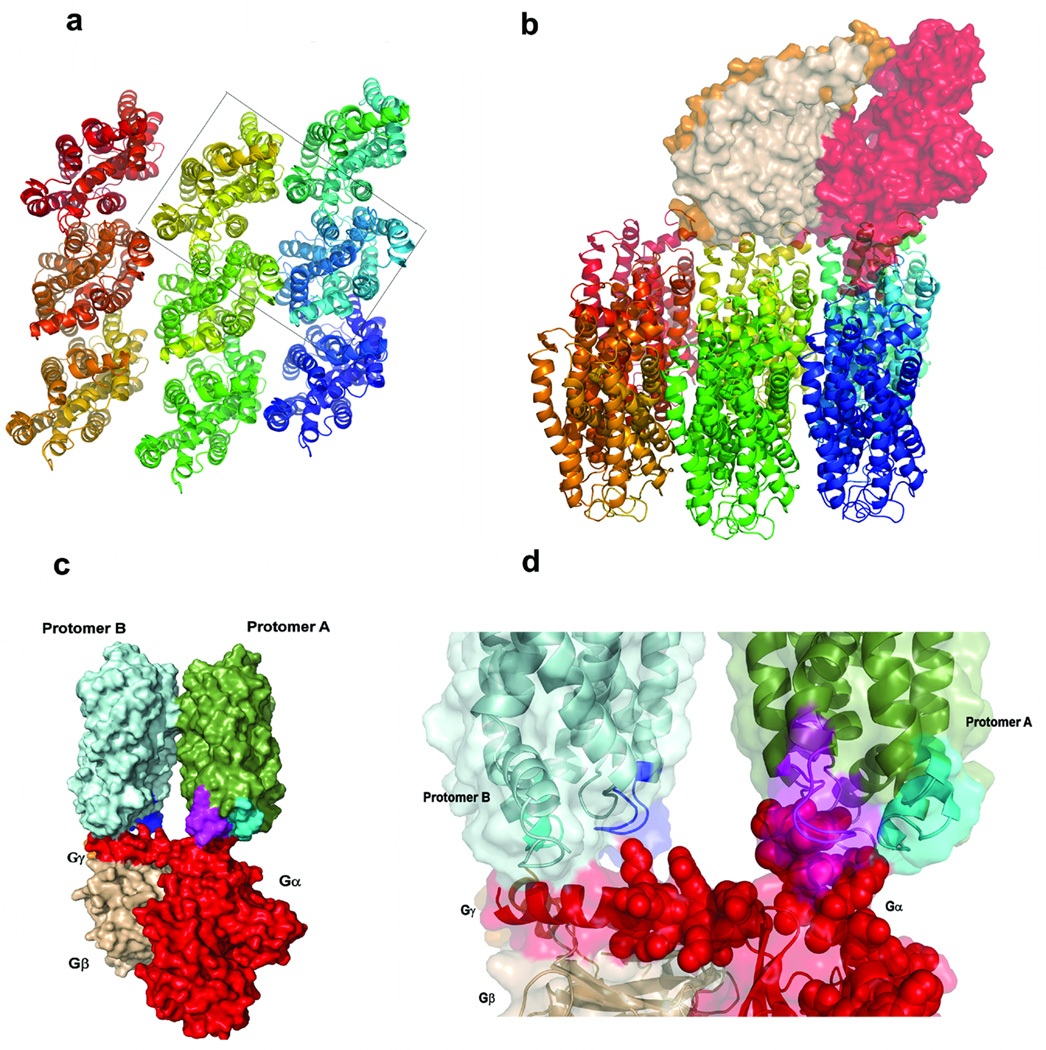
Figure 5. Computational model of the complex between the rhodopsin dimer and heterotrimeric Gt.
(a) Structural representation of the nonameric oligomer array; the dashed box identifies the TM4 dimer contained in Model 2. (b) Structural representation of the complex formed between transducin and the nonameric oligomer array. The optimal representative structure (defined in Methods) is shown for Model 2. (c) Closeup view of the interaction between specific residues of Gα (rendered in red, CPK representation) and the IL3 (cyan) and IL2 loops of protomer A and B (magenta and blue, respectively). (d) Side view of the complex showing Gtα (red), Gtβ (wheat), Gtγ (orange), protomer A (green), protomer B (light blue), IL2 of protomer A (magenta), IL2 of protomer B (blue), and IL3 of protomer B (cyan). Other views of the model complex are shown in (Supplementary Fig. 10 online).

