
Figure 2. Survival Analysis For Genotype and Depression Severity Subtypes.
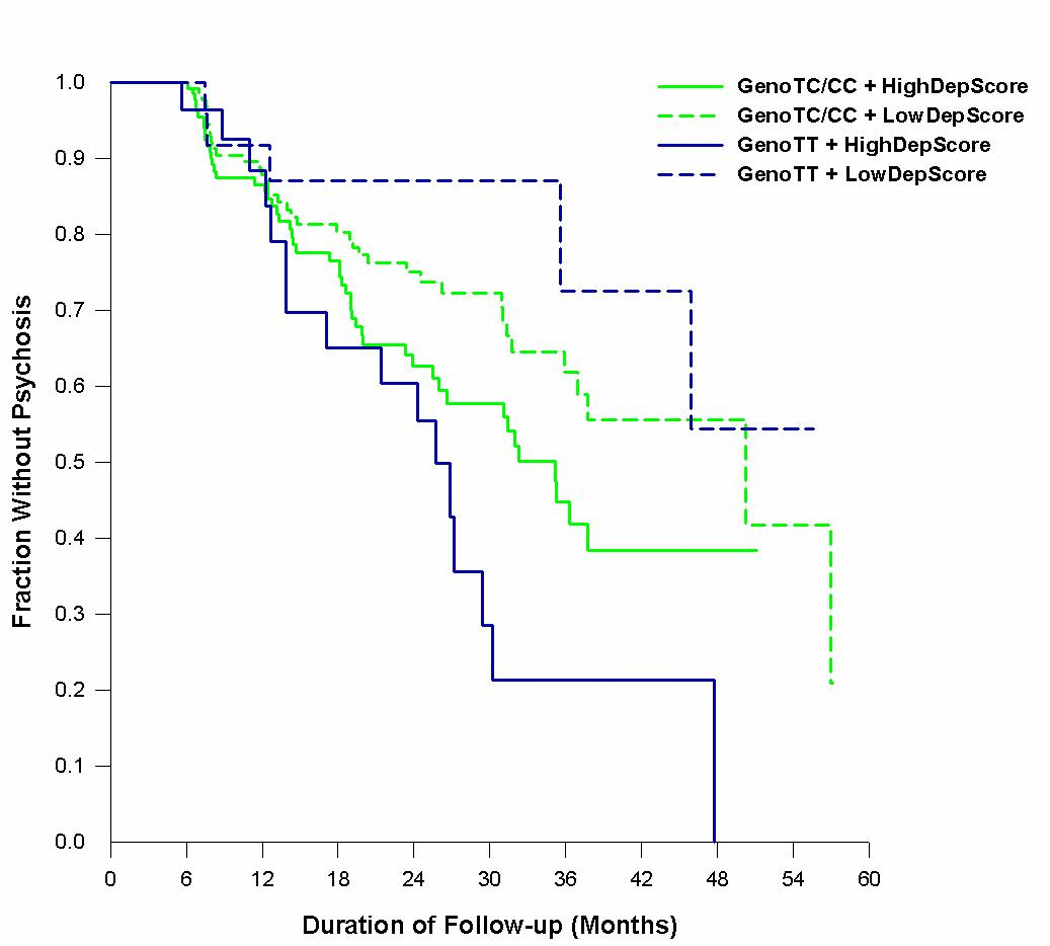
The vertical axis represents the fraction of subjects without psychosis; the horizontal axis represents the duration of follow-up of each genotype and depression severity subtype.