Figure 2.
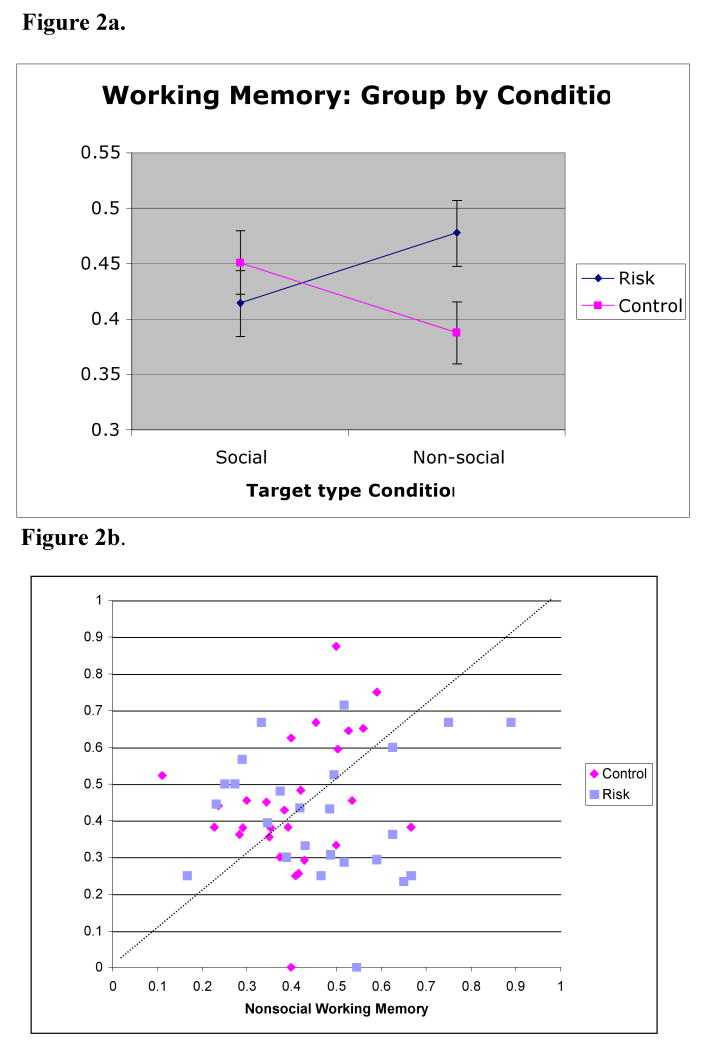
Figure 2a. Working memory performance by Target Condition for sibs-TD (n=30) and sibs-ASD (n=25). Least square means estimates and corresponding standard errors.
Figure 2b. The individual distribution of social vs. nonsocial working memory scores contributing to the interaction depicted in Figure 2a. The dashed line indicates equal success between social and non-social conditions. Where data is complete, average of the 6.5 and 9-months visit is included. Otherwise, the data is from the single available visit.

