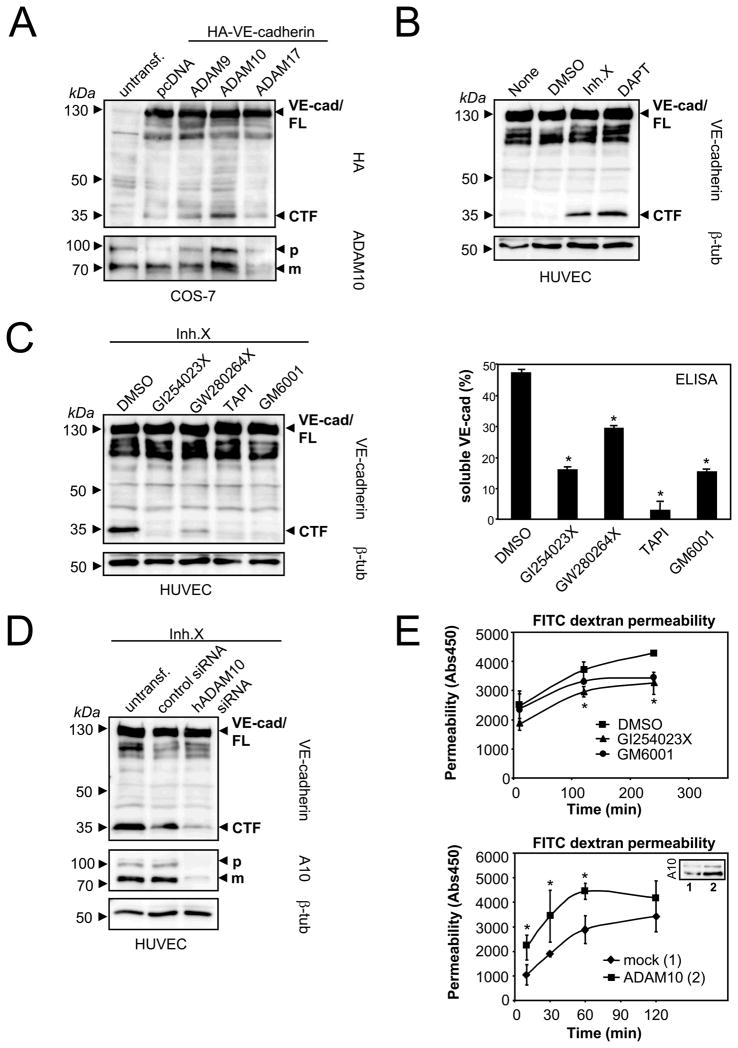
Figure 1. ADAM10 mediates VE-cadherin shedding and modulates endothelial permeability.
A) ADAM10 overexpression increases VE-cadherin proteolysis. Cos-7 cells were cotransfected with HA-VE-cadherin and empty vector (pcDNA3.1), ADAM9, ADAM10 or ADAM17. Cells were analyzed by immunoblot using anti-HA antibody (lower panel). The same blot was reprobed with an anti-ADAM10 antibody. FL: full length; CTF: C-terminal fragment; p: precursor of ADAM10; m: mature form of ADAM10. B) HUVECs were treated with DMSO, γ-secretase inhibitor X (1 μM) or γ-secretase inhibitor DAPT (10 μM) for 18 hours, followed by lysis and immunoblot analysis using C-terminal VE-cadherin antibody. C) HUVECs were incubated with DMSO, ADAM10 inhibitor (GI254023X, 10 μM), ADAM10/17 inhibitor (GW280264X, 10 μM), broad-spectrum metalloproteinase inhibitors TAPI (20 μM) or GM6001 (10 μM) for 18 hours. Cell pellets were analyzed for the generation of VE-cadherin CTFs by immunoblotting (left panel) and for the release of soluble VE-cadherin ectodomain by VE-cadherin ELISA (right panel). One representative immunoblot and corresponding ELISA out of three experiments is shown. ELISA data are expressed as mean±SD. *P<0.05 vs DMSO treated cells. D) HUVECs were transiently transfected with control siRNA or hADAM10 siRNA. Cell pellets were harvested 48 hours after transfection and analyzed for VE-cadherin CTF generation and ADAM10 expression by immunoblotting. Tubulin was used as loading control. E) ADAM10 modulates endothelial permeability. HUVECs were grown to confluence on porous collagen-coated transwell filters and pretreated with DMSO, GI254023X (10 μM) or GM6001 (10 μM) for 30 min. Permeability for FITC-dextran (40 kDa) was measured at different time points in a fluorescence plate reader (λEX 485 nm; λEM 525 nm) (upper panel). HUVECs were either transfected with empty vector (1, insert) or with ADAM10 (2, insert) and seeded on transwell filters. 48 hours after transfection and after monolayer formation permeability for FITC-dextran (40 kDa) was measured (lower panel). One representative out of three experiments is shown, respectively. Data are expressed as mean±SD. *P<0.05 GI vs DMSO treated cells (upper panel). *P<0.05 vs mock transfected cells (lower panel).

