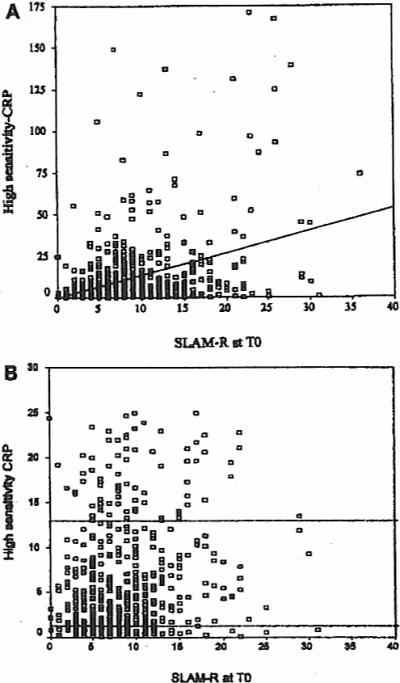
Figure 1.
A. SLAM-R scores (x axis) and hs-CRP (mg/l, y axis) were determined in 588 SLE patients at enrollment (T0). A positive correlation was foond between these variables (r = 035, p < 0.001). B. SLAM-R scores and hs-CRP levels shown in greater detail for patients with hs-CRP levels ≤ 25 mg/l. Broken lines represent 25th–75th percentiles.

