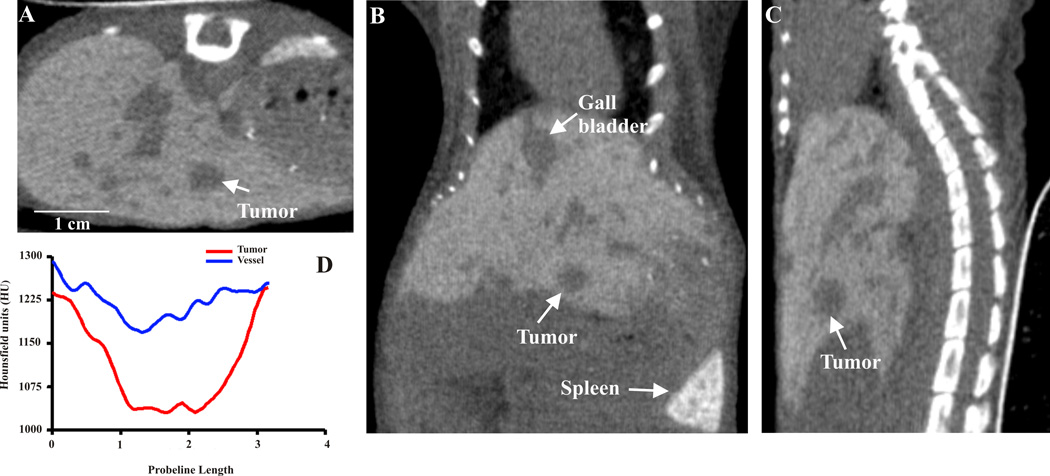
Fig. 1.
Micro computed tomography (CT) images acquired after hepatocyte-specific contrast (Fenestra™ LC) 3 hours post injection. Transverse (A), coronal (B), and sagittal (C) views of the abdomen in a nude mouse with developed liver lesions. The arrow points to the same lesions in all views. Line-profile data (D) visualizing the liver parenchyma (1220–1240 HU) – trough liver tumor (1025–1060 HU) in contrast to the vasculature (1170–1300 HU).

