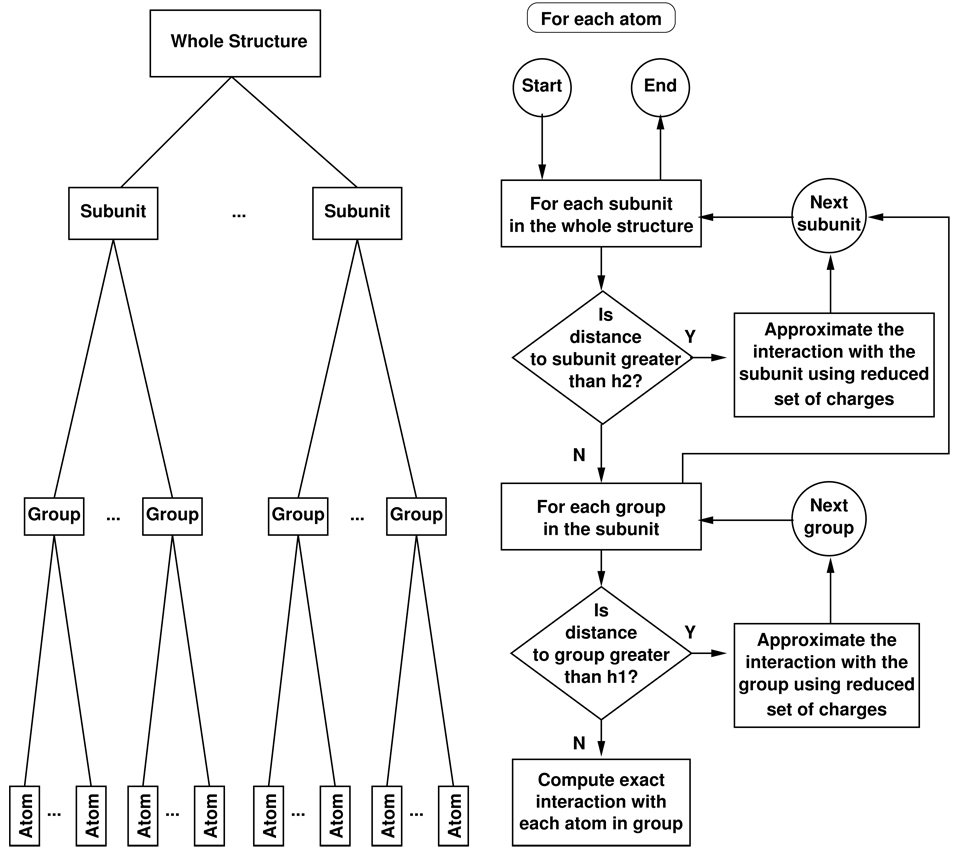
Figure 2.
Illustration of hierarchical partitioning and the HCP algorithm for two levels of approximation. The graph on the left shows the partitioning of the whole structure into subunits which are partitioned into groups, which in turn are partitioned into atoms. The flowchart on the right shows the top-down algorithm for the computation of long range interactions. Here h1 and h2 are the level 1 (group) and level 2(subunit) threshold distances respectively.

