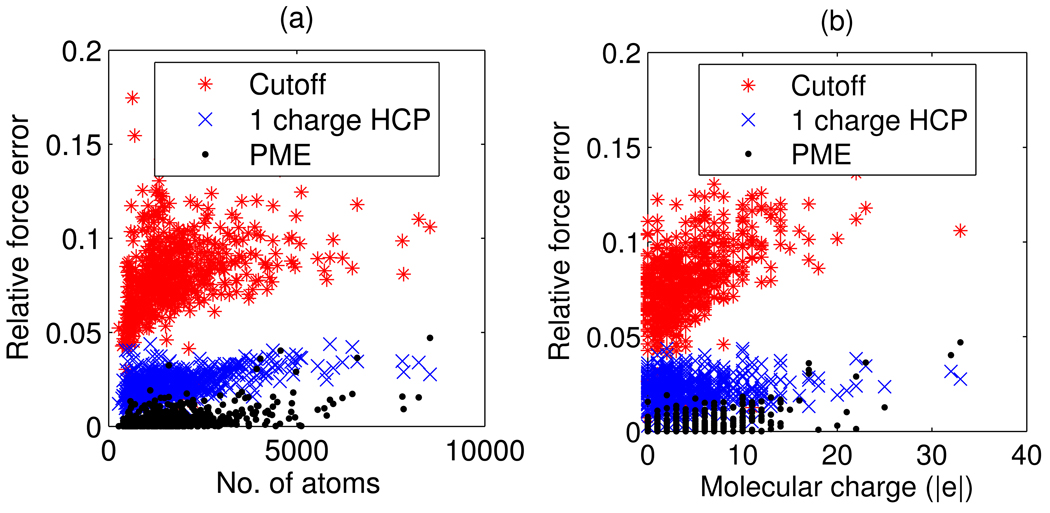
Figure 4.
Correlation between accuracy and size/charge for the spherical cutoff, HCP and PME methods. Accuracy, as measured by relative force error, is plotted as a function of (a) molecular size as measured by the number of atoms, and (b) absolute molecular charge. The HCP uses a 1-charge approximation with group threshold h1 = 10 Å. The PME and spherical cutoff methods use a 10 Å cutoff distance. The correlations are computed using the group level (level 1) approximation for the 595 subunits out of the 600 biomolecular structures in our sample set.

