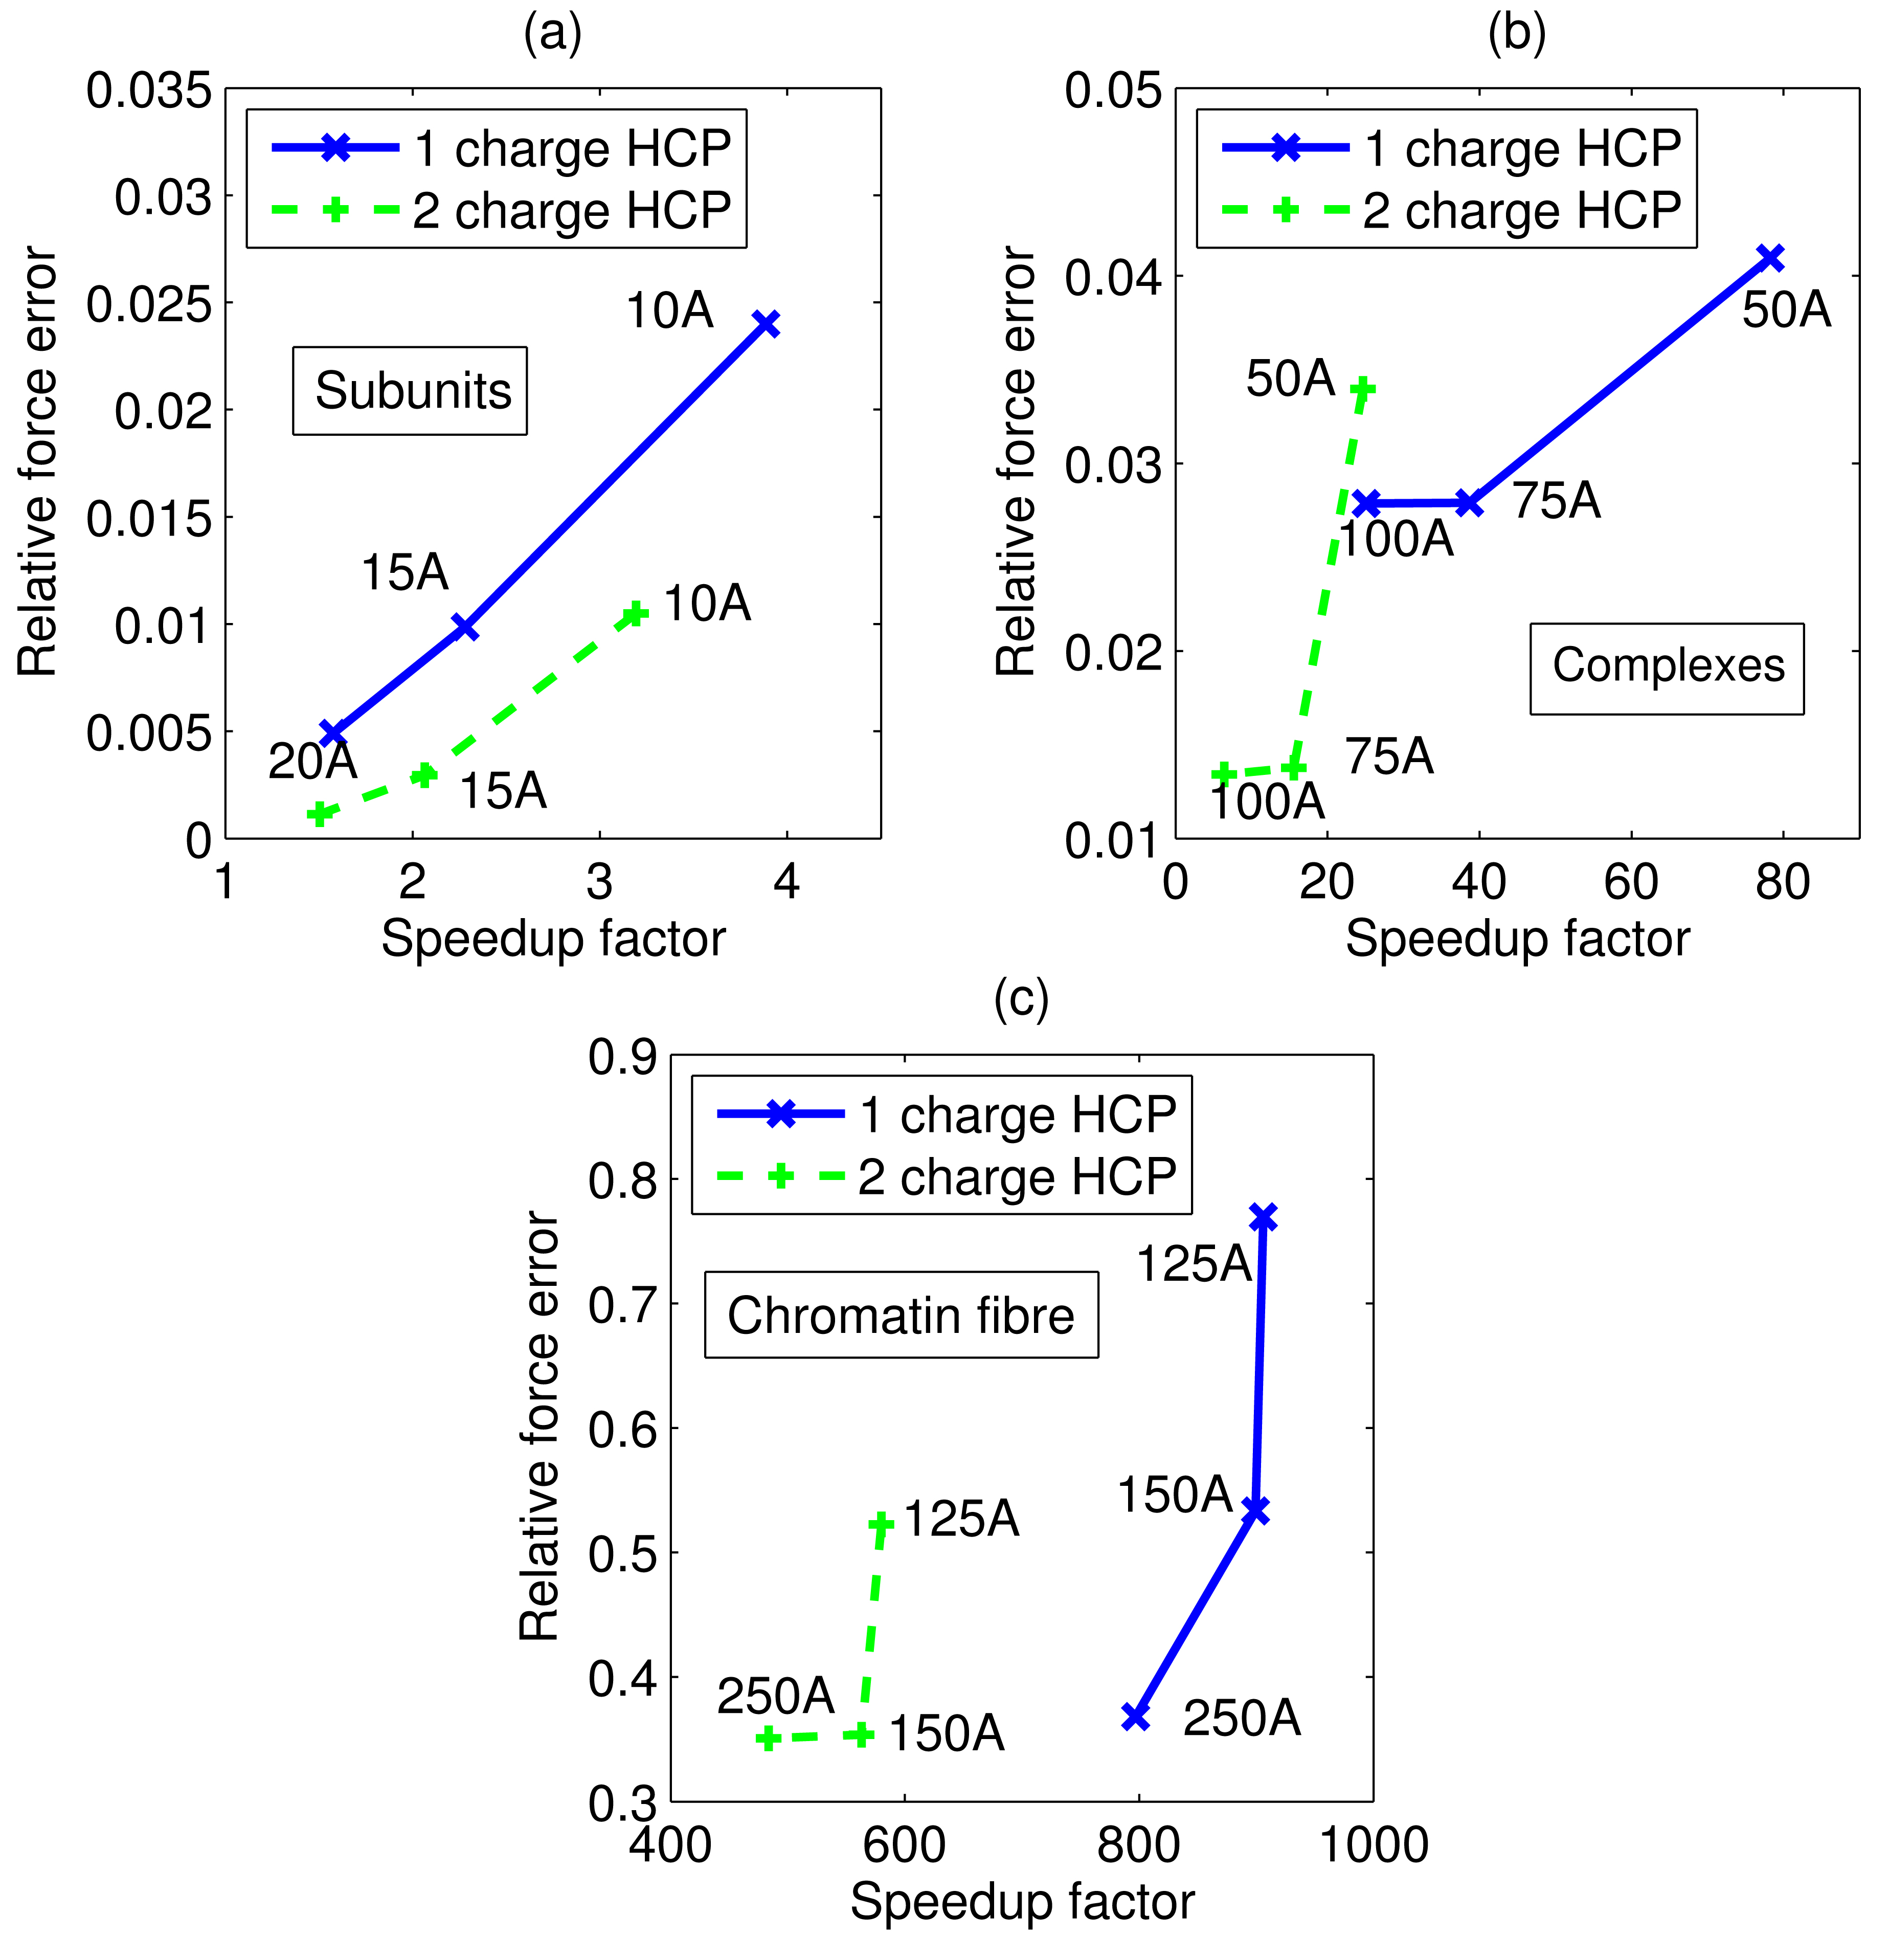
Figure 5.

Trade-offs between accuracy (relative force error) and speed for the HCP. (a) Average trade-off for our sample set of 595 real biomolecular subunits. Group (level 1) threshold distance for each data point shown next to the data point. (b) Average trade-off for our sample set of 4 complexes, using group (level 1) threshold distance h1 = 10 Å. Subunit (level 2) threshold distance for each data point shown next to the data point. (c) Average trade-off for the chromatin fibre, using h1 = 10 Å and h2 = 70 Å group (level 1) and subunit (level 2) threshold distances. Complex (level 3) threshold distance for each data point shown next to the data point. Connecting lines shown to guide the eye.
