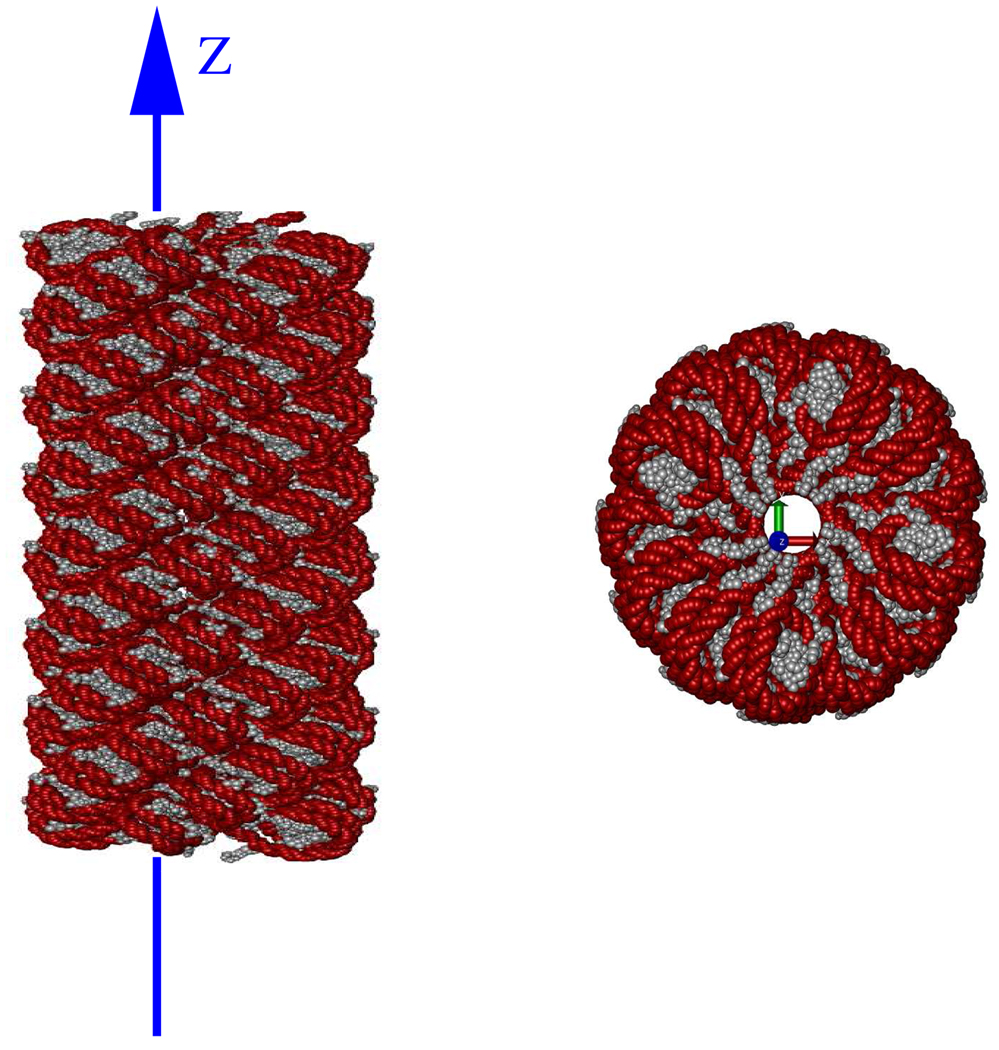
Figure 6.
Geometric setup used for estimates of discontinuities at the threshold boundaries. Left: Chromatin fibre showing the line along which electrostatic potential is calculated. Right: Cross-section of chromatin fibre looking down the fibre axis. The line passes through the central core as close as 3 Å from some of the atoms surrounding the core. Image rendered using VMD68

