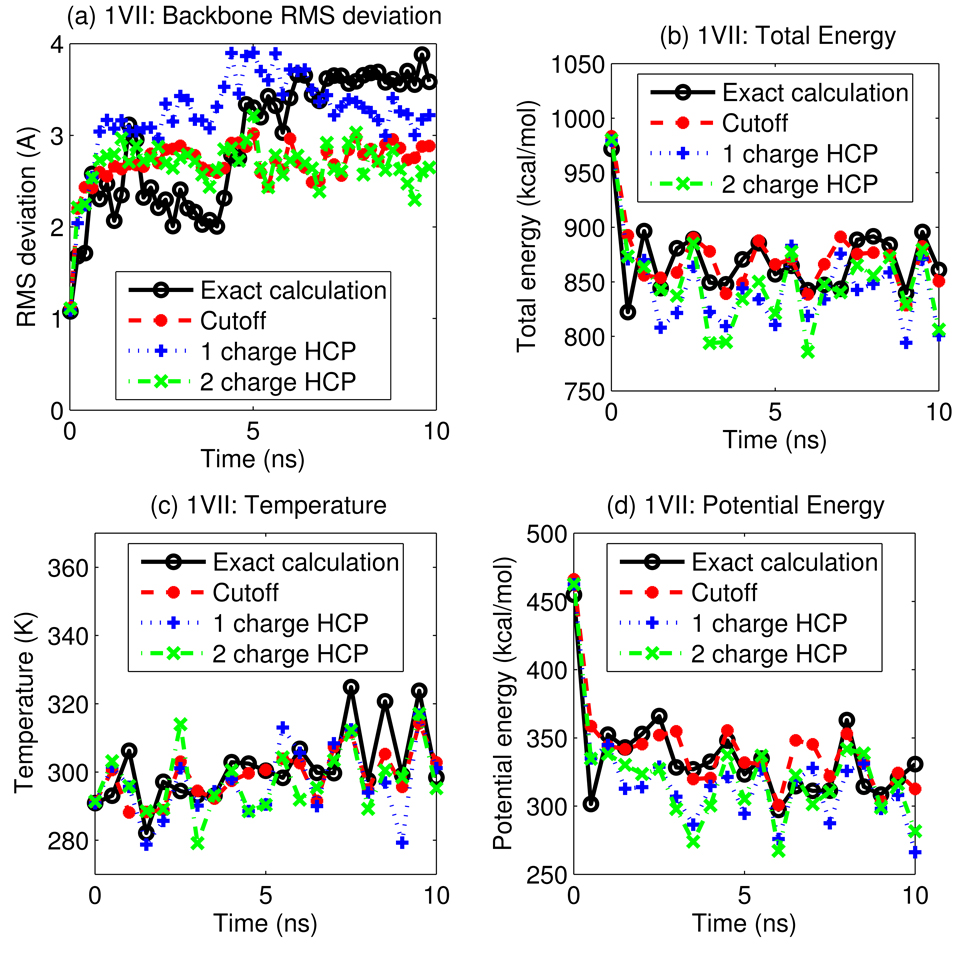
Figure 9.
A 10 ns simulation of villin headpiece protein, PDB id 1VII, using the HCP for long-range electrostatic computations, is compared to simulations using the exact all-atom computation and the spherical cutoff method. (a) RMS deviation of backbone atoms from the initial structure, (b) total energy, (c) temperature, and (d) potential energy, are shown as a function of simulation time. Data is plotted every 0.5 ns. Connecting lines are shown to guide the eye.

