Figure 1.
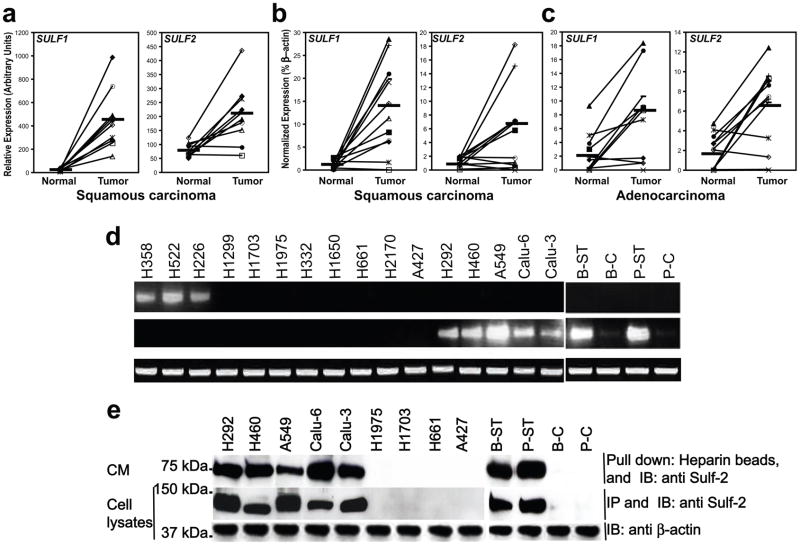
SULF transcript and protein expression in NSCLC tumors and lung cancer cell lines: (a) DNA microarray analysis of SULF1 and SULF2 expression in squamous cell lung carcinomas and adjacent normal lung. Results were mined from (www.functionalglycomics.org, core E, #887). SULF1 (Left) and SULF2 (Right) transcripts in normal lung vs. lung squamous cell carcinomas (10 cases, lines connect individual patient values). Mean values (horizontal black bars) increased 18-fold for SULF1 (p=0.0005) and 3-fold for SULF2 (p=0.003). qPCR determinations of SULFs (normalized to % b̃actin) in (b) lung squamous cell carcinomas (12 cases) and (c) lung adenocarcinomas (12 cases) vs. adjacent normal lung samples. Relative to normals, SULF1 and SULF2 increased 12-fold (p=0.008) and 4-fold (p=0.05) in squamous carcinomas and 3-fold for both (p=0.003 and p=0.002, respectively) in adenocarcinomas. (d) RT-PCR analysis of SULFs in NSCLC cell lines (H358; H522; H266; H1299; H1703; H1975) and smoke transformed cells (B-ST; P-ST) and their respective parentals (B–C; P-C) with b actin as control. (e) Immunoblotting of Sulf-2 in conditioned medium (Upper) and lysates (Middle) of indicated cells with b-actin as loading control (Lower).

