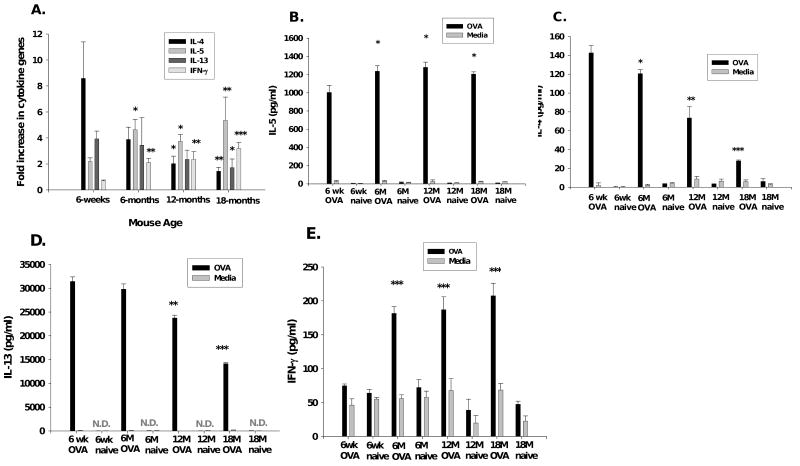
Figure 3.
Pulmonary tissue and spleen-cell culture cytokines. (A) qPCR for IL-4, -5, -13, IFN-γ, expressed as fold increase in copy number. Each OVA-mice group=6-9 mice. Spleen-cells cultured with OVA or medium alone, supernant ELISA for (B) IL-5, (C) IL-4, (D) IL-13, (E) IFN-γ. Culture results from pooled data from three experiments are presented as mean±standard error. *, p<0.05; **, p<0.01; ***, p<0.001 compared to 6-week OVA-mice. N.D.=non-detectable.

