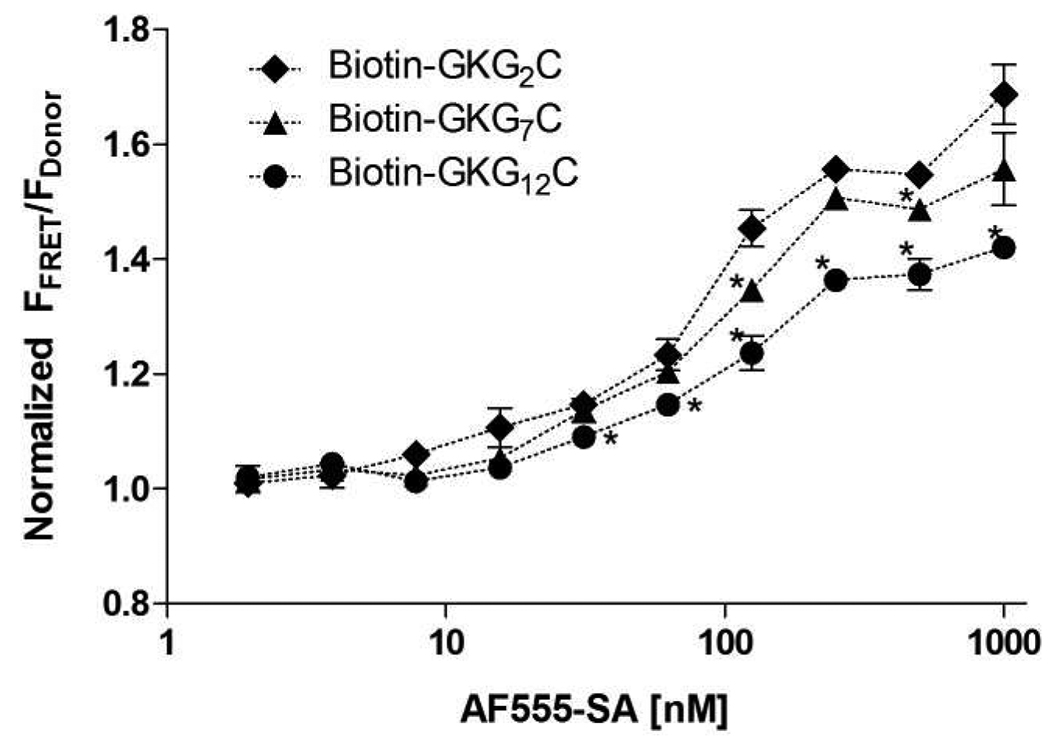
Figure 1.
FRET of AlexaFluor555-SA and Biotin-peptide (2000 nm) with different spacer lengths in PBS. FRET was expressed as ratios of the fluorescence in the FRET filter or FFRET (Ex: 485nm, Em: 590nm) and the fluorescence in the donor filter or FDonor (Ex: 485nm, Em: 535nm) without further calibration. (Asterisks designate statistical significant as per Students’ T-test compared to Biotin-GGKG2C group; N=4, mean ± SEM; p<0.05)

