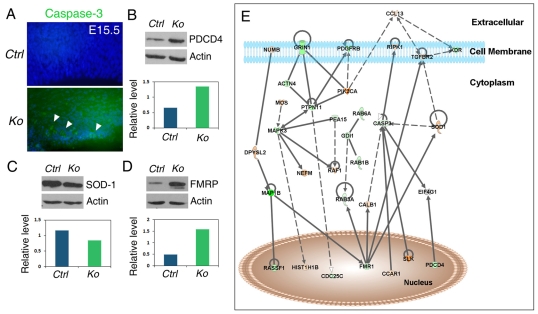
Fig. 6.
Cell-death pathways affected by Dicer deletion in NSCs and progenitors. (A) An increased amount of apoptotic progenitor cells, detected by activated Casp-3 (arrowheads), was detected in E15.5 cortices of Dicer KO mice compared with controls (Ctrl). (B) Expression of PDCD4 was increased in Dicer-deficient NSCs, as detected by western blotting assays. Actin served as a loading control. Shown as one example experiment, relative levels of PDCD4 expression were normalized by actin expression between Ctrl and KO. (C,D) Decreased expression of SOD1 and increased expression of FMR1 were detected in Dicer-deficient NSCs, as analyzed by western blotting assays. Shown as example experiments; relative levels of SOD1 and FMR1 expression were normalized by actin expression between Ctrl and KO. The representative western blotting results shown here are from neurosphere cultures of at least three Dicer KO and three control animals. (E) A simplified network generated from proteins identified to be differentially expressed in NSCs of Dicer KO and Ctrl. It illustrates FMR1 as a hub protein in miRNA- and Dicer-dependent regulation of cell death and survival. The intensity of the node color indicates the degree of up- (red, representing >twofold higher in Ctrl compared with KO) or down- (green, representing >twofold higher in KO compared with Ctrl) regulation. The complete network is shown in supplementary material Fig. S7.

